
The most popular advice about SonarQube test coverage is also some of the least useful: pick a percentage, make the quality gate enforce it, and assume the team is safer. A passing test suite can still produce 0% coverage in SonarQube when the report never reaches the scanner, while a high percentage can come from tests that barely exercise meaningful behavior.
A better target is a trustworthy reporting pipeline. Tests must execute the code that matters, coverage tools must write compatible reports, and SonarScanner must import those reports after they exist. Only then does the metric help engineering leaders protect critical user journeys instead of rewarding coverage padding.
Table of Contents
- Rethinking Coverage Targets in Modern Pipelines
- How SonarQube Calculates Coverage Metrics
- Integrating Language Specific Coverage Tools
- Enforcing Quality Gates on New Code
- Troubleshooting Zero Percent Coverage Errors
- Building a High Signal Automation Strategy
Rethinking Coverage Targets in Modern Pipelines
A coverage percentage can pass while critical user journeys remain untested. SonarQube reports coverage from external test tools and imported reports, rather than executing the tests itself, as explained in the SonarSource explanation of coverage reporting. The metric becomes useful only when the pipeline proves that the relevant tests ran and that their results reached the scanner correctly.
That makes the reporting path part of test quality. A weak result may indicate missing tests, but it may also reflect an absent report, an unsupported format, mismatched file paths, or a scanner stage that starts before the report is created. Check those handoffs before asking developers to add assertions. Otherwise, teams can spend time inflating a number while the CI configuration still hides actual execution gaps.
Coverage should answer a risk question
A useful review connects the report to engineering risk:
- What executed: Did tests exercise the code paths changed in the pull request?
- What matters: Do they protect authentication, payments, account changes, data exports, or another business-critical journey?
- What was reported: Can the SonarQube result be traced to a report generated by the build?
- What remains exposed: Are uncovered lines and conditions concentrated in risky behavior?
A single threshold rarely fits every component. A utility module with simple transformations does not need the same testing approach as authorization logic or an order workflow. The percentage can also change after developers remove dead paths, refactor code, or consolidate implementation. Treating that movement as a standalone quality verdict creates pressure for shallow tests.
Practical rule: Approve a coverage threshold only when you can explain which user journeys it protects and how the pipeline verifies that the relevant tests ran.
Strong teams prioritize signal quality over metric volume. They keep fast, focused checks near the change, use integration or end-to-end tests for important system behavior, and investigate unexplained reporting gaps before changing the threshold. SonarQube then supports release decisions with evidence from the build, instead of acting as a scoreboard for test-counting exercises.
How SonarQube Calculates Coverage Metrics
SonarQube's coverage metric does not just divide the number of executed lines by the total lines in a repository. Its documented formula is:
coverage = (CT + LC) / (B + EL)
The variables represent different parts of execution:
- CT is the number of conditions evaluated to true at least once.
- LC is the number of covered lines.
- B is the total number of conditions.
- EL is the total number of executable lines.
The SonarQube metric definition shows why branch and condition behavior matters. A test can execute a line containing a decision without exercising every meaningful outcome of that decision. Counting only lines would make that test look stronger than it is.
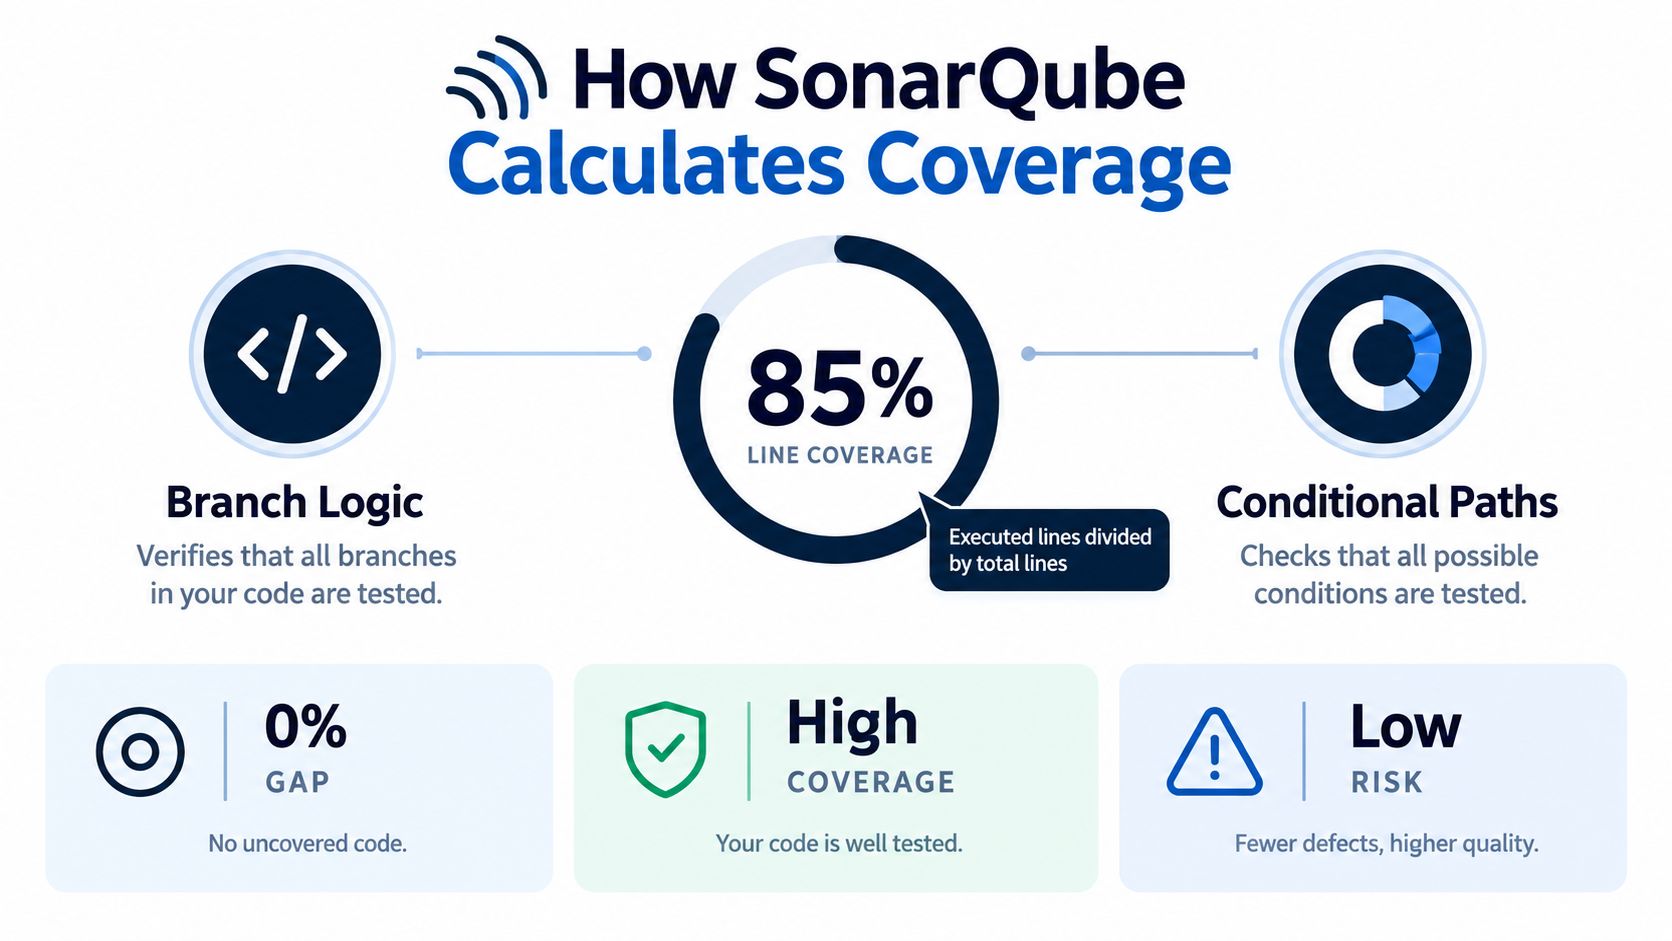
Line execution isn't behavioral validation
Consider code that checks whether a request is authenticated, whether an account is active, or whether an amount is within an allowed range. A test may execute the decision line while exercising only the ordinary path. Condition coverage pushes the team to ask whether the relevant alternatives were evaluated, not merely whether the file was touched.
That doesn't mean every condition deserves an identical test design. Some branches are defensive checks with limited risk, while others determine access, money movement, or irreversible state changes. The metric gives you a map of execution gaps. Engineers still need domain knowledge to decide which gaps require stronger tests.
SonarQube also exposes a separate metric called new_coverage. It applies the same calculation, but restricts the measurement to newly added or updated source code. This distinction is important for teams working in mature repositories, where a project-wide result can be dominated by historical code that nobody changed in the current delivery cycle.
Read the formula before setting a gate
A quality gate based on the blended metric can expose a different weakness than a line-only dashboard. Before enforcing it, review how your language tool reports executable lines, conditions, and source paths. A mismatch between the tool's report and SonarQube's file mapping can make the result appear lower or empty even when the test runner succeeded.
SonarQube's historical documentation also distinguishes between imported coverage data and the metrics it presents after analysis. Earlier Server guidance stated that coverage reports describe the percentage of code covered by test cases and that SonarQube itself doesn't calculate coverage from scratch in that product context. Current documentation defines how the platform calculates the metric once line and condition data are available. Operationally, both points lead to the same requirement: the build must generate valid evidence before analysis begins.
Integrating Language Specific Coverage Tools
SonarQube doesn't run your test suite for you. Your test runner and coverage tool produce the evidence, then SonarScanner imports it. The pipeline must therefore make the handoff explicit: install dependencies, execute tests with coverage, verify the report exists, and only then run analysis.
The exact command depends on the language and build system. The principle doesn't change, whether your team uses Maven, Gradle, npm, Yarn, pytest, or a custom CI runner.
Java with JaCoCo
For Java projects, JaCoCo commonly runs through Maven or Gradle. Configure the build so tests produce an XML report, then point SonarQube at that generated file when the scanner doesn't discover it automatically.
With Maven, the lifecycle typically attaches JaCoCo to the test phase and generates XML under the build output directory. A scanner property such as sonar.coverage.jacoco.xmlReportPaths should reference the actual generated path, not a path copied from another agent or an earlier build layout.
The practical checks are straightforward:
- Run tests first: The JaCoCo report must be created after the test process finishes.
- Use XML output: Confirm the report format matches what the SonarQube analyzer expects.
- Preserve source paths: Keep compiled classes, source files, and report paths aligned on the analysis agent.
- Inspect the artifact: Open the report or list its location in CI before launching SonarScanner.
JavaScript and TypeScript with Jest or Istanbul
Jest can generate coverage through Istanbul, while projects using nyc can collect coverage around other test commands. Configure the test command to emit an lcov report and ensure the scanner property points to the resulting lcov.info file, commonly through sonar.javascript.lcov.reportPaths.
The most common mistake is assuming that a local developer command and the CI command produce the same output. A developer may run tests without coverage locally, while the CI job runs a separate script with a different working directory. Make the coverage command part of the pipeline definition and fail early if the expected report isn't present.
TypeScript adds another mapping concern. The report must map executed JavaScript back to the repository's TypeScript sources, so source maps and project paths need consistent treatment. If SonarQube can see the report but can't match files, the result may be incomplete or misleading.
Python with pytest-cov
Python teams commonly use pytest-cov to produce a Coverage.py XML report. The scanner property sonar.python.coverage.reportPaths should reference the generated coverage.xml file.
Run pytest with coverage against the intended package or source directory, not only the test directory. Then verify that the report contains the repository paths SonarQube analyzes. Containerized builds often expose path differences when the report is generated in one workspace and scanned in another, so preserve the same checkout structure where possible.
The following reference table keeps the handoff visible during pipeline reviews:
| Language | Tool | Required Output Format | Key Configuration Flag |
|---|---|---|---|
| Java | JaCoCo | XML | sonar.coverage.jacoco.xmlReportPaths |
| JavaScript or TypeScript | Jest, Istanbul, or nyc | lcov | sonar.javascript.lcov.reportPaths |
| Python | pytest-cov or Coverage.py | XML | sonar.python.coverage.reportPaths |
Teams choosing a framework should evaluate runner support, diagnostics, parallel execution, and CI behavior alongside syntax and developer preference. A useful comparison is this guide on how to choose a test automation framework, especially when the framework decision will shape how coverage evidence is generated and maintained.
Build contract: The test job owns report creation. The analysis job owns report import. Keep those responsibilities explicit, and make the analysis job verify the handoff instead of silently continuing.
Enforcing Quality Gates on New Code
Applying a strict project-wide gate to a legacy repository often turns historical debt into a permanent release blocker. The better strategy is to protect the code being changed now, using SonarQube's new_coverage metric rather than forcing the team to remediate every old gap before it can ship a safe feature.
SonarQube documents new coverage as the same blended calculation used for overall coverage, restricted to newly added or updated source code. That makes it suitable for pull requests and incremental delivery. Developers receive feedback on the code they own in the current change, while unrelated legacy files don't dilute the decision.
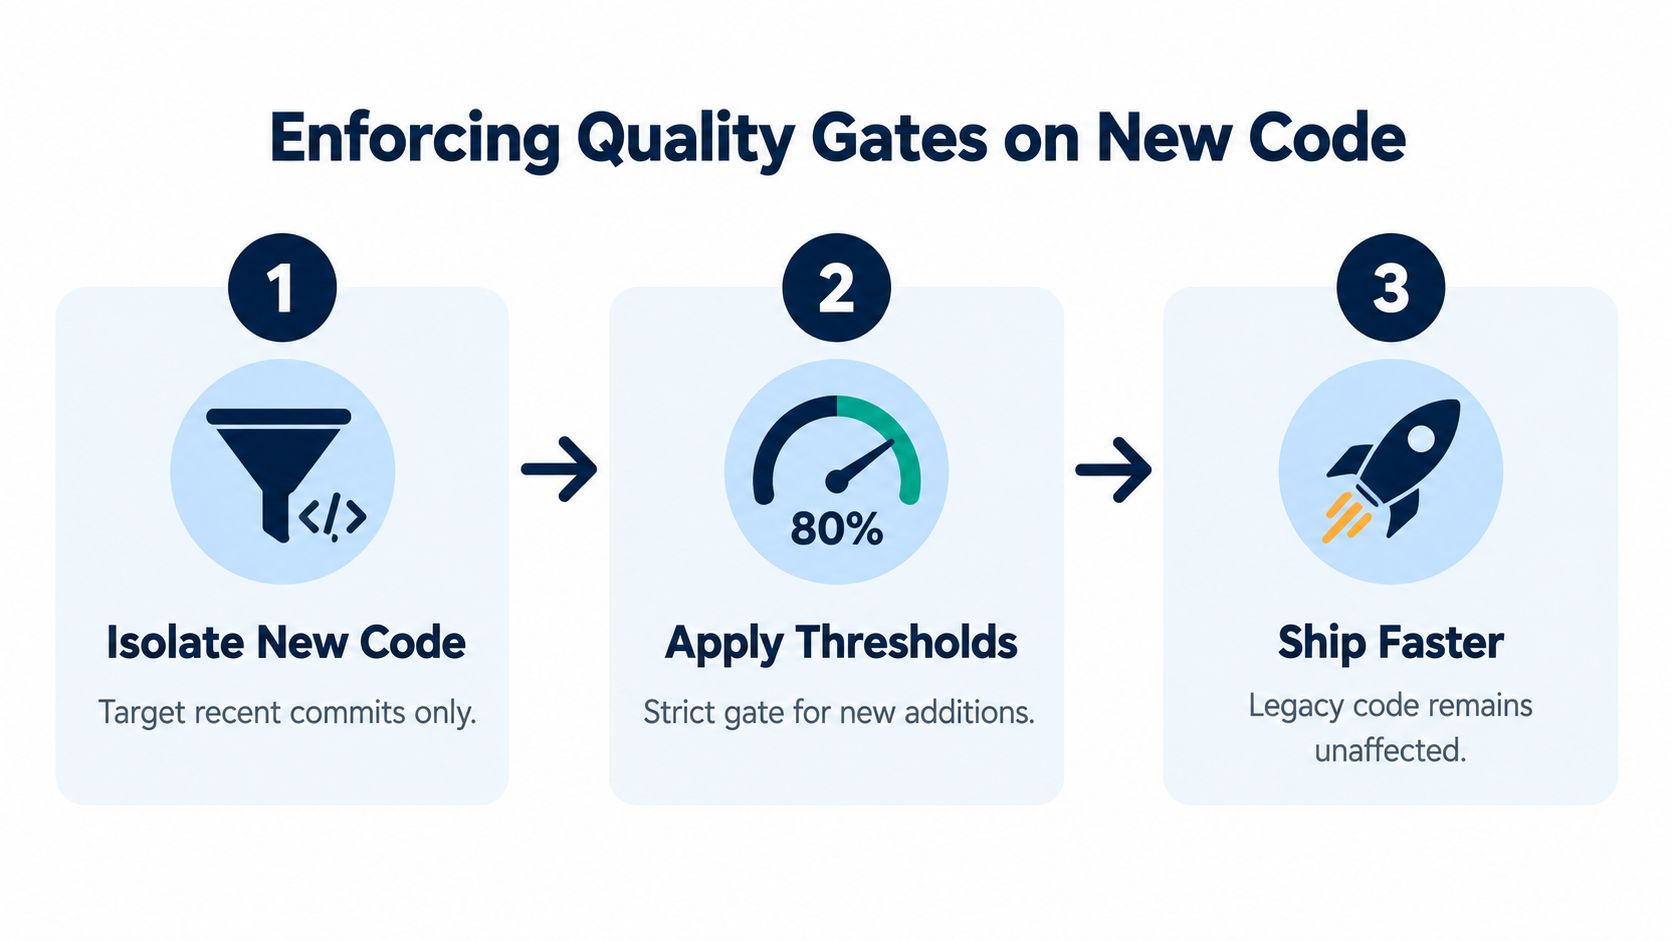
Define the baseline precisely
A new-code gate is only useful when SonarQube can identify what counts as new. The project needs consistent source control metadata, a reliable reference branch or leak-period configuration, and scanner settings that match the branch model used by the organization.
Review the result on the same change that will be merged. If the new-code window includes generated files, migrations, vendored code, or formatting-only churn, the gate may measure noise instead of engineering risk. Exclusions should be deliberate and documented, because broad exclusions can make a healthy dashboard look better while hiding important gaps.
Choose thresholds by consequence
The brief's supporting material mentions a commonly suggested threshold of 80% to 90% for coverage on new code, but that range should not be treated as a universal rule. The source presents it as practical guidance, not as a law of software quality. A team should choose a threshold based on failure impact, change complexity, test maturity, and the quality of its condition coverage.
For a low-risk internal component, a review warning may be more appropriate while the team improves its reporting process. For authentication or billing logic, a blocking gate can be justified when the pipeline also runs the tests that validate critical behavior. The percentage is a policy input. It isn't proof that a release is safe.
- Block missing evidence: A changed component with no valid report should trigger investigation rather than pass without notice.
- Review uncovered risk: Look at uncovered conditions and changed user journeys, not only the aggregate value.
- Allow explicit exceptions: Record why an urgent change bypassed the gate and create follow-up work.
A quality gate should shorten debate during code review, not replace engineering judgment. Teams that use new-code coverage well combine it with defect findings, review of critical flows, and clear ownership for failed reports. Guidance on why releases feel risky is relevant here because release confidence depends on the quality of the evidence, not on a single dashboard number.
Keep the gate fast and local
Run the relevant tests before analysis on pull requests, then use broader suites at merge or release stages where their duration is acceptable. The pull-request signal should be quick enough that developers can act on it while the change is still fresh.
Legacy improvement can proceed separately through focused refactoring. That approach keeps delivery moving while gradually reducing exposure, rather than making every new feature responsible for the entire repository's history.
Troubleshooting Zero Percent Coverage Errors
A zero result with passing tests usually points to a broken reporting handoff, not an absence of tested code. Common causes include a missing report, an unsupported or incorrect format, deprecated properties, mismatched paths, or scanner execution before the tests finish. Treat the percentage as an evidence-delivery problem until the pipeline proves otherwise.
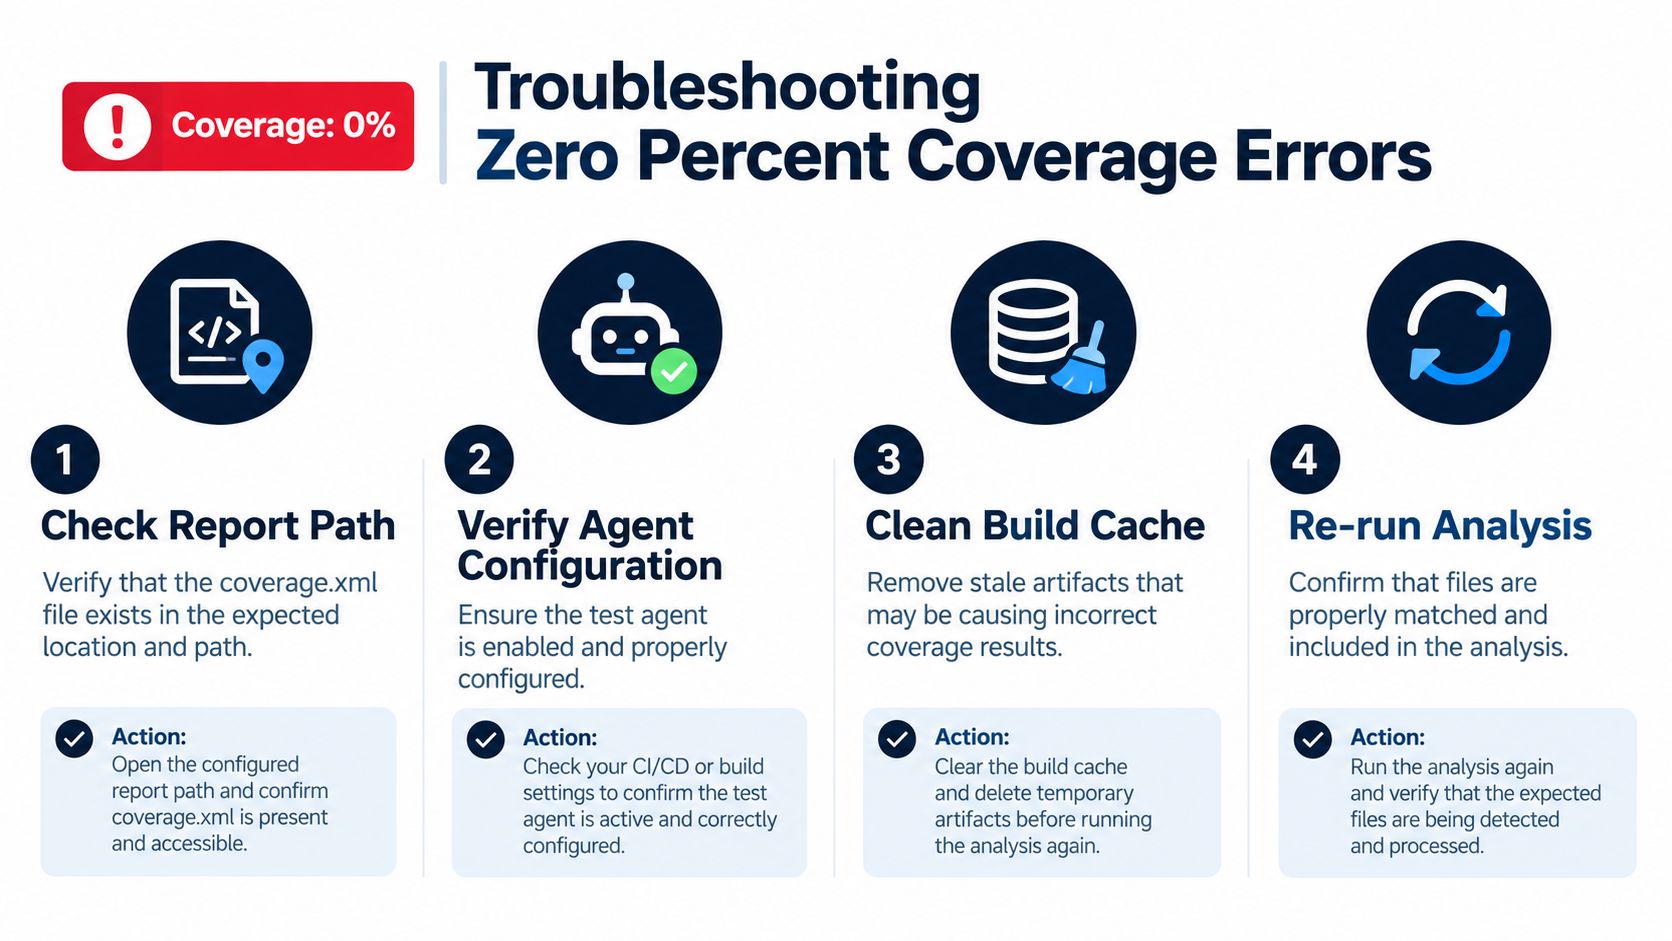
Start in the build workspace, not on the SonarQube dashboard. The dashboard can display only the report data that the scanner found, read, and matched to analyzed source files.
Check whether the report exists
Ask the first diagnostic question plainly: did the test job create the expected file? Add a CI inspection step immediately after the test command. List the coverage directory, verify the expected filename, and confirm that the file contains data rather than an empty placeholder.
If the file is missing, correct the test command or coverage-tool configuration before changing SonarQube properties. The scanner cannot import an artifact that the preceding job never produced. This check also separates a test-execution failure from a reporting failure.
Confirm the format and property
A valid report in the wrong format remains unusable. Java projects may generate a binary or HTML artifact while the scanner expects JaCoCo XML. JavaScript projects may create a report directory without the lcov file configured in sonar.javascript.lcov.reportPaths. Python projects may produce a data file while the scanner property points to an XML report.
Check the property supported by the analyzer version in use. Old examples often remain in repositories after scanner behavior changes. Remove deprecated properties, select the current language-specific setting, and make the configured path match the file generated by the test job.
Match paths across agents
Path mismatches frequently appear in containers and multi-job pipelines. The test job may record source paths under one workspace root, while the analysis job checks out the repository somewhere else. The report can be present and syntactically valid, yet SonarQube cannot associate its entries with analyzed files.
Compare the paths recorded inside the report with the scanner's working directory. Keep checkout locations consistent where possible. If jobs are separate, publish the report as a CI artifact and download it before analysis. Avoid rewriting paths unless you understand how both the coverage tool and analyzer resolve source files.
Verify execution order and stale artifacts
The scanner must run after tests and report generation. In a parallel pipeline, analysis may begin before the coverage artifact is available, creating a successful-looking analysis with no coverage data.
Stale workspaces create another failure mode. A report from an earlier commit may be imported against current source files, while a cached directory makes a local build appear healthy even though a clean CI agent fails. Use a clean build when the result is unexplained, then rerun tests and analysis from the same commit.
Diagnostic sequence: Find the report, validate its format, inspect its paths, confirm the scanner property, then prove the execution order. Change one variable at a time.
Read the scanner log last, or revisit it after each change. Look for messages about imported files, ignored reports, unresolved paths, deprecated properties, or analysis scope. A zero result should remain an observability failure until artifact checks and logs show that the report was present, readable, and matched to source files.
Building a High Signal Automation Strategy
SonarQube can tell you whether reported execution reached lines and conditions. It can't determine whether the test selected the right business behavior, whether an assertion is meaningful, or whether the system remains reliable across a real user journey. Those decisions belong in the test strategy.
A high-signal suite starts with risk mapping. Identify the workflows whose failure would damage revenue, trust, compliance, or operational continuity. Then combine the right test levels around those workflows, rather than forcing every behavior into a large unit-test count.
Test the path customers depend on
End-to-end automation should cover critical journeys across the interfaces customers use. API checks can validate contracts and failure handling, integration tests can expose service boundaries, and unit tests can isolate complex rules efficiently. The layers support one another, but they don't provide interchangeable evidence.
A payment or authentication flow may require an end-to-end check because only the full journey reveals session, permissions, persistence, and integration failures together. A pure unit suite can still report strong execution while missing a broken route, invalid configuration, or incompatible service response.
Use functional automation testing as part of a broader system design, not as a synonym for adding more scripts. The framework should make failures diagnosable, isolate test data, support parallel execution where appropriate, and preserve results that engineers can act on.
Make coverage evidence operational
A mature pipeline connects three signals:
- Execution evidence: The report proves which source lines and conditions the tests reached.
- Journey evidence: Functional checks prove that critical workflows still behave correctly.
- Release evidence: The quality gate, defect findings, and review context support a deliberate ship decision.
This model avoids the false choice between unit coverage and end-to-end testing. It also prevents teams from using SonarQube as a substitute for test design. A small suite of stable, meaningful checks can be more useful than a large collection of brittle tests that inflate a percentage and slow every change.
The metric should expose risk, not conceal it.
Review failures by cause. If coverage falls because a critical branch lacks a test, add the test. If coverage disappears because a report path broke, repair the pipeline. If the metric rises while production regressions continue, examine assertion quality, test isolation, environment parity, and missing user journeys.
AskYourQA designs complete automation systems around business-critical flows, including functional, API, security, performance, and CI/CD testing. Visit AskYourQA to discuss a coverage and reporting pipeline that gives your engineering team reliable evidence before each release.