
Performance testing puts a software system under controlled load so you can measure how fast, stable, and reliable it remains. In one benchmark, JMeter recorded a 90th-percentile response time of 0.095 seconds while Locust recorded 0.280 seconds under the same default-settings conditions.
You may be dealing with this problem right now. A flash sale begins, shoppers arrive at checkout, and a page that normally feels immediate starts taking seconds to respond. Customers refresh, retry payments, or abandon their carts while the team watches dashboards that still show an acceptable average. By the time someone connects the slowdown to lost orders, the damage has already reached production.
That's why performance testing isn't a box to tick after functional testing. It's a way to expose speed, capacity, stability, and recovery risks while the team can still change the code, infrastructure, workload design, or release plan. The practical challenge isn't learning what latency or throughput means. It's translating a business expectation into a realistic traffic model, percentile-based thresholds, and lightweight checks that provide useful feedback throughout delivery.
Table of Contents
- The Moment Performance Testing Stops Being Optional
- The Five Flavors of Performance Testing
- Metrics That Actually Tell You Something
- Designing a Workload That Mirrors Real Users
- Tools Worth Knowing in 2026
- Where Performance Testing Fits in the SDLC
- Reading the Results Without Fooling Yourself
- A Practical Starting Point for Your Team
The Moment Performance Testing Stops Being Optional
During a flash sale, thousands of shoppers may follow the same path: open a product page, add an item, review the cart, and submit payment. If the checkout service slows down, each step holds connections and consumes resources that other shoppers need. A short delay can become a queue, then a wave of retries, then a wider failure across dependent services.
Performance testing is the practice of placing a system under controlled, measurable load to learn how it behaves before real users find its limits. You're not only asking whether a request eventually succeeds. You're asking whether the application responds quickly enough, keeps processing transactions correctly, uses resources safely, and recovers when demand exceeds its design assumptions.
Practical rule: Treat performance testing as risk reduction. A test is valuable when it helps the team make a decision, not merely when it produces a dashboard.
A release can pass every functional check and still fail under concurrent activity. The checkout may calculate totals correctly for one user but time out when many users compete for the same database connections. This is one reason teams should examine why releases feel risky, especially when fast delivery leaves little room for late discovery.
The right questions are practical:
- Speed: How long do important journeys take under expected demand?
- Capacity: How much traffic can the system handle before service quality degrades?
- Stability: Does performance remain consistent during sustained use?
- Failure behavior: Do errors remain controlled, and can the system recover?
- Scalability: Does adding capacity improve the result, or only increase infrastructure cost?
The rest of the work follows from these questions. You'll choose a test type, model user behavior, select metrics, define thresholds from business requirements, run the test at the right lifecycle stage, and interpret results without confusing a comfortable average with a reliable customer experience.
The Five Flavors of Performance Testing
Each performance test answers a different operational question. A team that runs only one flavor may learn that the system survives one condition while missing the failure mode that matters most to the business.
| Test Type | Goal | Typical Duration | Failure Mode It Exposes |
|---|---|---|---|
| Load testing | Validate expected traffic and normal operating behavior | A planned test window | Slow responses, bottlenecks, or errors under anticipated demand |
| Stress testing | Find the system's limits and observe failure recovery | Until defined saturation or failure conditions | Crashes, rejected requests, queue growth, and poor recovery |
| Soak testing | Check stability during sustained activity | An extended run | Memory leaks, connection exhaustion, and gradual degradation |
| Spike testing | Examine sudden traffic increases or decreases | Short, sharply changing periods | Autoscaling delays, overload, and unstable recovery |
| Scalability testing | Determine how behavior changes as capacity grows | Repeated runs across configurations | Ineffective scaling, uneven resource use, or rising cost without useful capacity |
Load testing establishes the expected case
Suppose an online store expects heavy activity during a scheduled promotion. A load test recreates the important browsing, cart, and checkout journeys at the expected traffic shape. The question is not “Can the server handle a large number of virtual users?” It's “Can the system complete the business transactions users will attempt while meeting the agreed service targets?”
Stress and spike testing expose different surprises
Stress testing deliberately moves past normal operating conditions. An auction platform might receive more bids than its architecture was designed to process. You want to know whether it rejects work cleanly, protects data integrity, and recovers, rather than leaving operators to discover the answer during an incident.
Spike testing changes the load abruptly. A coupon shared by an influencer can create a steep arrival surge that a gradual ramp-up never reproduces. The test should examine both the period of pressure and what happens after demand falls.
Soak and scalability tests reveal time and growth problems
A soak test keeps a meaningful workload running long enough to reveal slow resource loss. A service may look healthy in a short run but gradually consume memory or connections.
Scalability testing compares system behavior as you add resources or distribute traffic. More machines don't automatically produce more useful throughput. A shared database, lock, queue, or external dependency may remain the constraint.
Metrics That Actually Tell You Something
A performance report becomes useful when every metric answers a decision-making question. Throughput tells you how much work the system completes, while latency tells you how long users wait. Error rate shows whether the system is still producing correct outcomes, and resource signals help explain why behavior changed.
Average latency is easy to read but often too blunt. Percentiles show the distribution. The p50 describes the median experience, while p95 and p99 expose slower requests that an average can hide. A system can look healthy overall while a meaningful group of users waits long enough to abandon a journey.
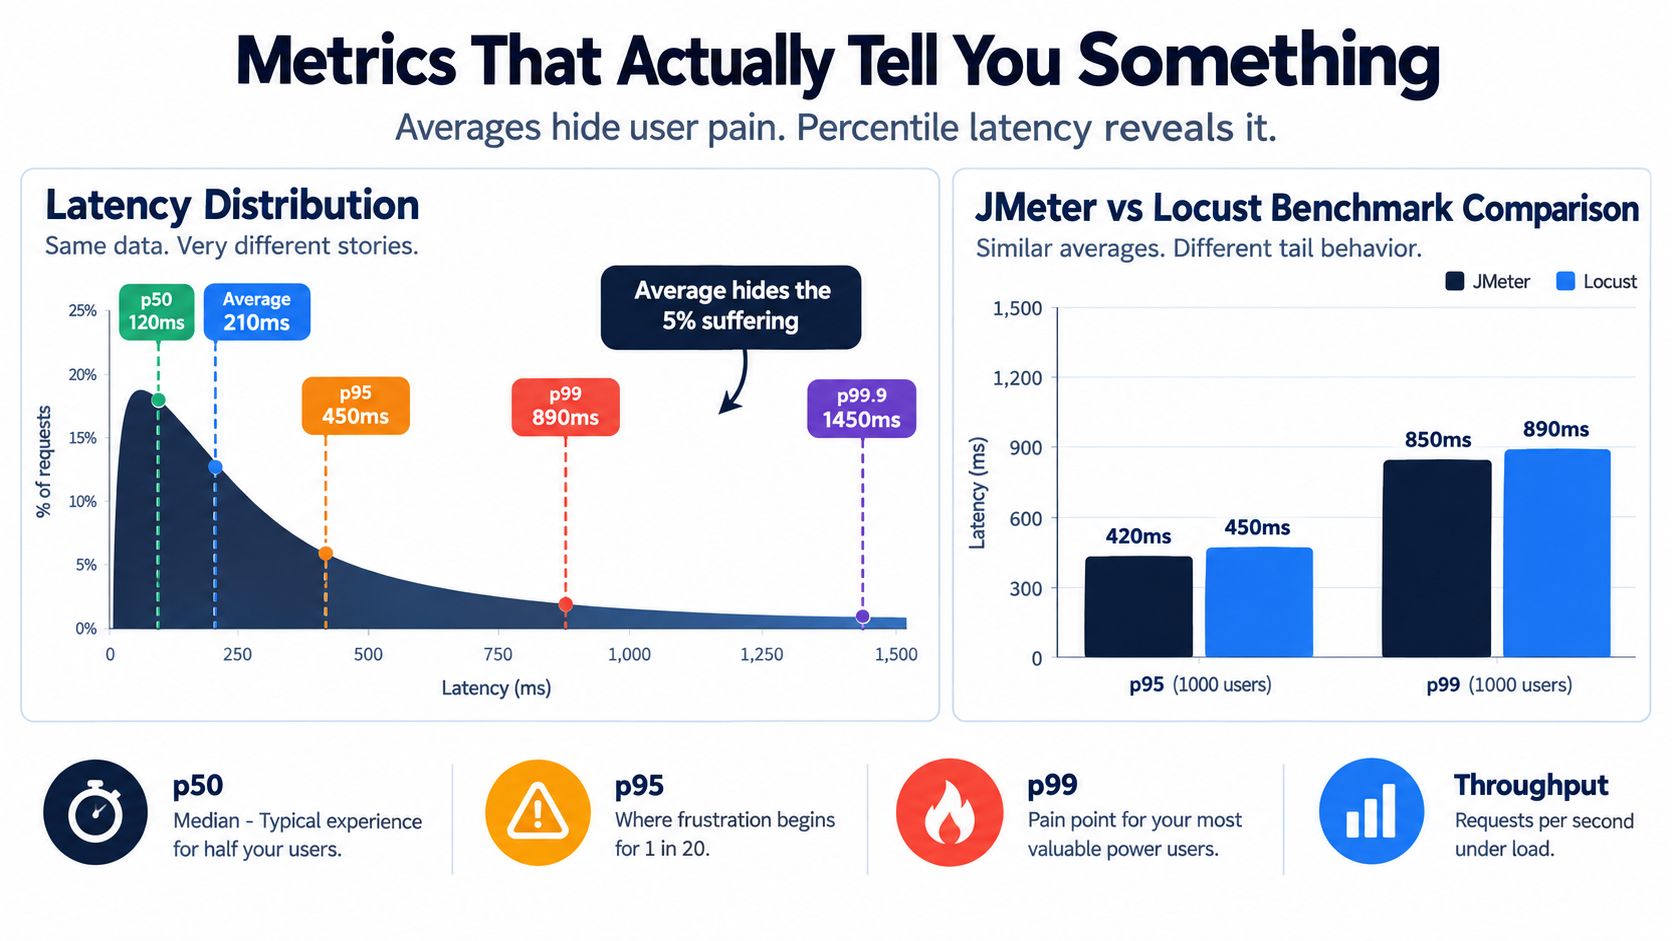
A comparative benchmark makes the point clearly. Under the same default-settings test conditions, JMeter showed a 90th-percentile response time of 0.095 seconds, while Locust showed 0.280 seconds, as documented in the comparative benchmark of open-source load-testing tools. The result doesn't mean one tool is universally better. It shows that tool choice and workload modeling can materially affect observed tail latency.
Read the metric families together
- Throughput: Requests per second or completed business transactions indicate how much useful work the system handles.
- Percentile latency: p50, p95, and p99 reveal typical and slow user experiences.
- Error rate: Failed requests, rejected transactions, and incorrect responses show when speed has become a correctness problem.
- Saturation signals: CPU, memory, database connections, queue depth, thread pools, and disk activity help locate constraints.
- Availability: Uptime during the test matters, but availability without usable response times isn't enough.
A p95 of 400 milliseconds with a p99 of 6 seconds would deserve investigation even if the average looks attractive. The slowest requests may belong to checkout, account creation, or another high-value journey. Thresholds should therefore connect to business risk. If a delay blocks payment, the acceptable limit may be stricter than for a background report.
Designing a Workload That Mirrors Real Users
A load test is only as honest as the script driving it. The label “virtual users” says very little unless you also define how those users arrive, what they do, how often they pause, and which data they use.
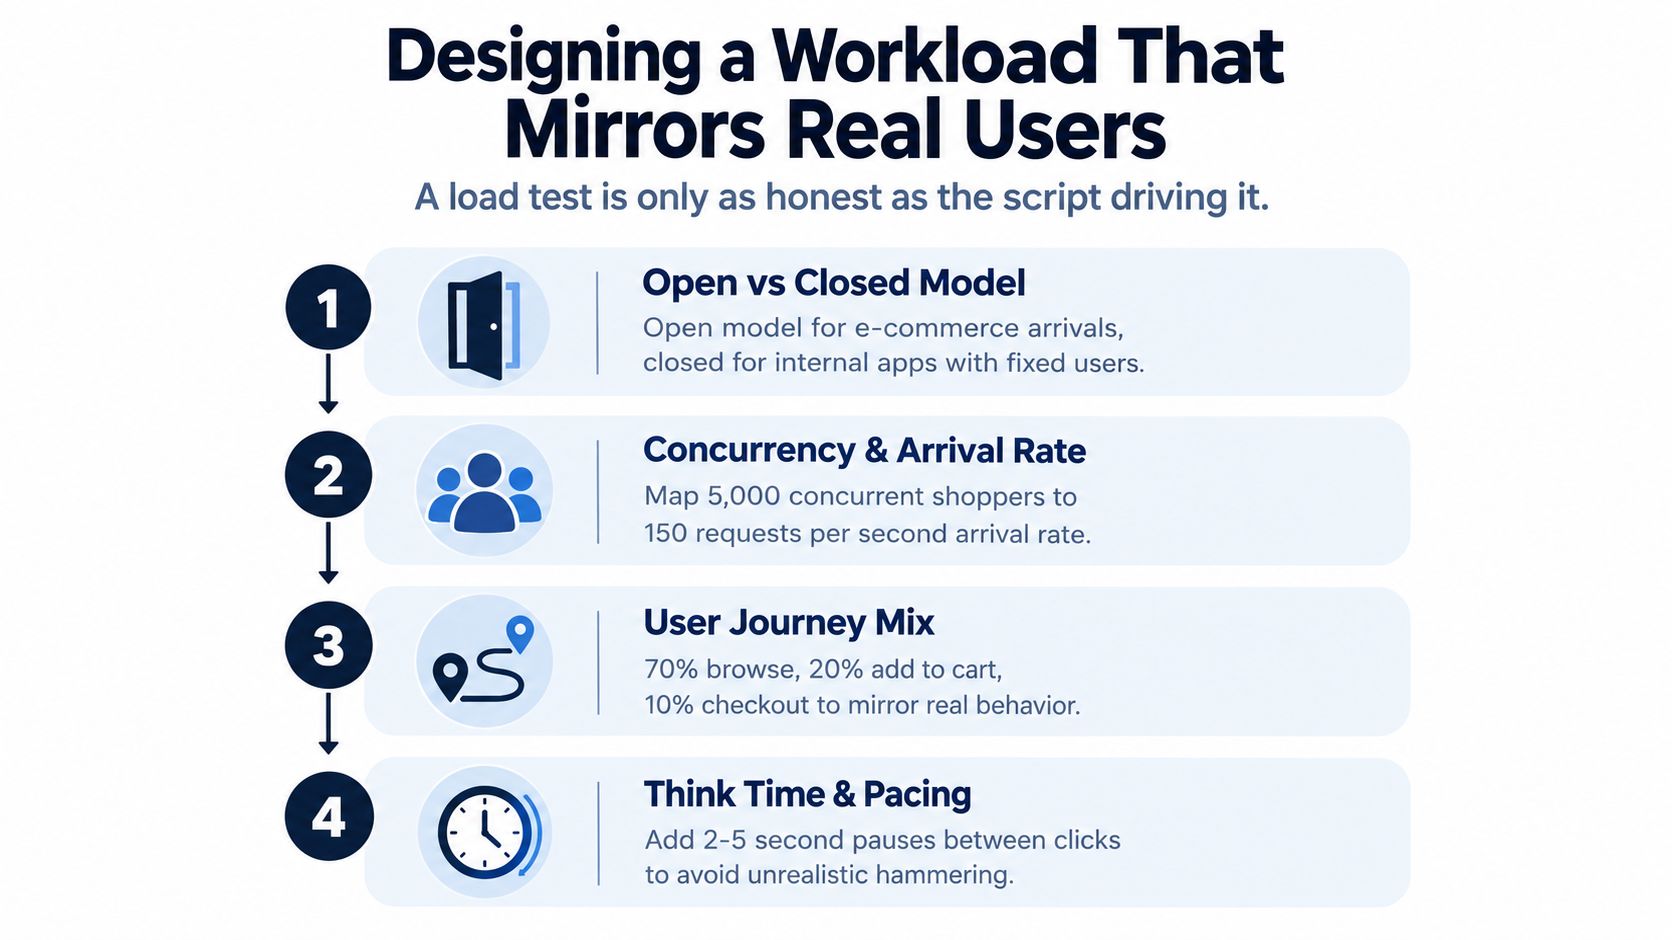
Start with the business statement. “Support concurrent shoppers” must become a runnable model with an arrival pattern, journey mix, pacing rules, and acceptance criteria.
Choose the arrival model
An open workload model sends users into the system independently of its current response time. This often resembles public e-commerce traffic, where arrivals continue even if the site is slowing down. The resulting queues and saturation can be important because real customers don't necessarily wait for the previous request to finish before another customer arrives.
A closed workload model keeps a fixed group of active users cycling through a journey. Each user waits for a response, thinks, and then starts another action. This can fit an internal application with a known user population, but it may hide the pressure created by an uncontrolled arrival stream.
Shape behavior, not just volume
Think time and pacing prevent a script from becoming an unrealistic request generator. Users read product information, compare options, and pause before submitting forms. Those pauses affect concurrency, throughput, and resource occupancy.
Ramp-up and ramp-down curves matter too. A gradual increase can reveal capacity trends, while an abrupt increase tests spike handling. Parameterize identities, search terms, products, accounts, and transaction data so the system exercises realistic cache behavior, database paths, validation, and writes.
Before approving a run, ask:
- Which user journeys matter most to revenue or customer retention?
- What is the expected arrival pattern, not just the desired concurrency?
- What percentage of activity is browsing, searching, writing, or checking out?
- Are the test records representative in size, freshness, and distribution?
- Does the test include think time, retries, redirects, authentication, and third-party calls?
- Which p95, p99, throughput, and error thresholds define success?
A claim such as “the system supports a thousand virtual users” is incomplete without these details. The same user count can produce very different pressure depending on pacing, transaction mix, dataset size, and workload model.
Tools Worth Knowing in 2026
Tool selection should follow the question you need to answer. A team testing an API on every merge has different needs from an enterprise validating global traffic across several regions.
Open-source, scriptable engines include JMeter, Gatling, and Locust. They suit engineers who want version-controlled scenarios, custom logic, protocol flexibility, and direct CI integration. They also require the team to own test design, load generation, result storage, and observability. JMeter's graphical interface can become awkward at very high concurrency, while code-based tools demand stronger scripting discipline.
Commercial and managed platforms include k6 Cloud, BlazeMeter, and LoadRunner Cloud. These products can help teams generate traffic from managed infrastructure, record journeys, centralize reports, and reduce operational work. The trade-off is commercial cost, especially when tests need substantial load, repeated execution, or broad geographic coverage.
APM-backed testing connects synthetic traffic with production telemetry. Dynatrace, Datadog, and New Relic can help correlate response behavior with application traces, infrastructure saturation, database activity, and service dependencies. APM doesn't replace a carefully designed load model, but it can shorten diagnosis after a test exposes a problem.
| Tool Category | Best Fit | Main Trade-off |
|---|---|---|
| Open-source scriptable engines | Engineering-led teams needing control and CI integration | More setup, maintenance, and reporting responsibility |
| Commercial managed platforms | Teams needing hosted load generation, recording, and dashboards | Ongoing licensing and usage costs |
| APM-backed testing | Teams connecting test behavior to operational telemetry | Observability depth depends on instrumentation and configuration |
The best tool is usually the one your engineers will run consistently. A feature-rich platform that nobody maintains produces less value than a smaller, versioned test suite that runs reliably and gives developers actionable failures. Teams evaluating broader automation can also review AI testing approaches when performance checks sit alongside functional, security, and AI-quality risks.
Where Performance Testing Fits in the SDLC
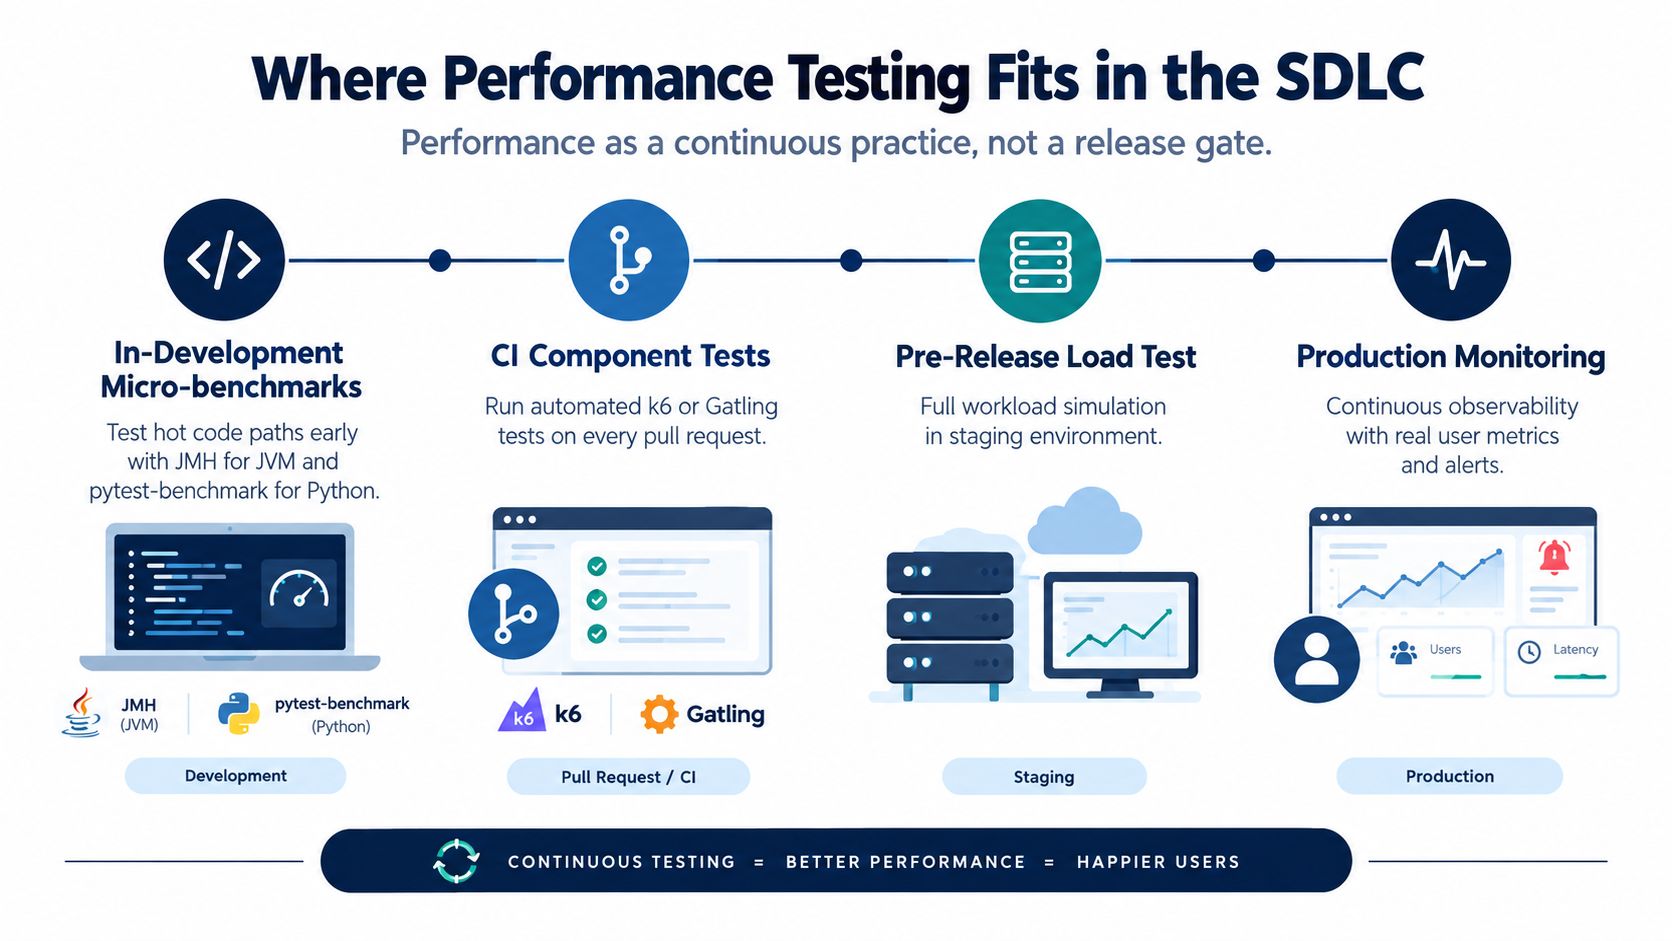
Performance testing works better as a layered practice than as a release-week ceremony. Each layer trades realism for speed, so the team can catch cheap regressions early and reserve deeper validation for changes that need it.
Start close to the code
Component-level micro-benchmarks target a hot function, parser, query builder, serializer, or algorithm. JMH fits JVM code, while pytest-benchmark fits Python projects. These tests don't predict end-to-end user experience, but they can show that a focused code path became slower before the change is buried inside a full application run.
Pull-request checks should stay narrow. A small API or component smoke test can detect an obvious latency regression, unexpected allocation, or degraded transaction path without turning every code review into a long capacity exercise.
Increase realism as the decision gets larger
A fuller load test belongs in a production-like staging environment. It should use a representative workload, realistic data, and monitoring that covers application and infrastructure behavior. Run it on a schedule or around meaningful merges and releases, depending on execution time and environment cost.
Pre-release soak and capacity tests provide evidence for a launch decision. Production synthetic checks then confirm that live behavior remains within expectations, but they complement earlier testing rather than replace it.
The useful pipeline pattern is simple:
- Development: Find local regressions in hot code paths.
- Pull request: Catch high-signal component and journey failures quickly.
- Staging: Validate realistic workload behavior and bottlenecks.
- Pre-release: Confirm capacity, recovery, and sustained stability.
- Production: Watch real user metrics and alert on meaningful drift.
Skipping the inexpensive checks makes later failures harder to diagnose. A full test may tell you that checkout slowed down, but a focused benchmark or pull-request check can help identify which change introduced the regression.
Reading the Results Without Fooling Yourself
A system can look fine at low concurrency and then deteriorate sharply after it crosses a saturation point. An academic test of an e-learning system illustrates the pattern. At 300 concurrent users, performance began to deteriorate and average response time reached 1486.66 milliseconds. At 1000 concurrent users, average response time rose to 10860.18 milliseconds, 90th-percentile latency reached 78840.30 milliseconds, and the error rate increased to 3.13%, according to the academic e-learning system performance test.
The important lesson isn't to copy those thresholds into another system. It's to recognize nonlinear degradation. The tail can become unusable before the average tells the full story, and correctness can deteriorate after queues, timeouts, and exhausted resources accumulate.
Three reading traps
Averaging across runs can hide variability. Compare equivalent runs, inspect distributions, and preserve the workload configuration beside the result. A single average across different traffic shapes isn't a reliable baseline.
Warm caches can conceal cold-start behavior. A cached product page and a first-time database query may follow different paths. Decide whether the business cares about both conditions, then test them deliberately.
Different workload models make direct comparisons unsafe. A closed test with fixed users and generous think time doesn't represent the same pressure as an open arrival stream. Record the model, pacing, data, environment, and build version with every result.
| Pitfall | What It Hides | Better Reading |
|---|---|---|
| Relying on averages | Slow tails and uneven user experience | Review p50, p95, p99, and the distribution |
| Testing only warm caches | Cold-start cost and first-request behavior | Separate warm and cold scenarios |
| Comparing unlike workloads | The effect of arrival rate and pacing | Compare only equivalent models and conditions |
| Watching latency without errors | Correctness failures during saturation | Read latency, throughput, errors, and saturation together |
| Testing without infrastructure telemetry | The likely bottleneck | Correlate application results with CPU, memory, queues, and connections |
Set pass/fail criteria before the run. Tie p95 and p99 targets to the journey's business importance, then pair them with an error ceiling and resource guardrails. That gives product owners a defensible decision: the build passed or failed against an agreed risk boundary, not an engineer's changing impression.
A Practical Starting Point for Your Team
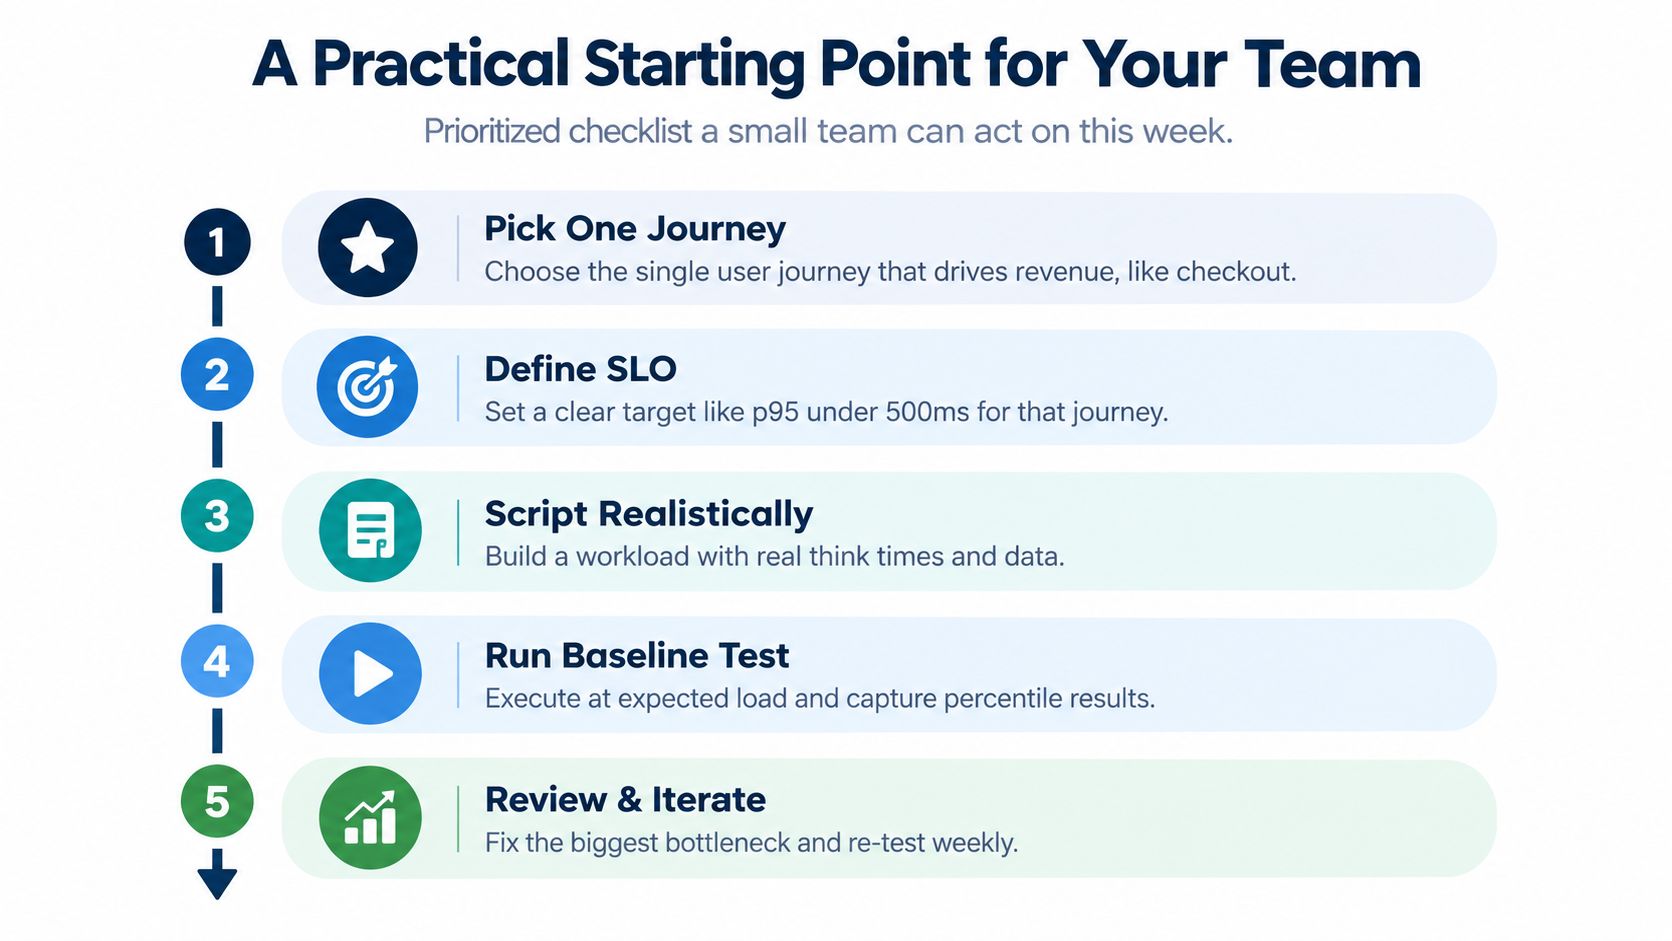
Small teams don't need a giant performance program to begin. They need one important journey, a repeatable workload, a baseline, and a feedback loop that turns failure into a specific engineering task.
Start with the path that carries the clearest business risk. For an online store, that may be checkout rather than a rarely used settings page. For a subscription product, it may be sign-up and plan activation. Keep the first script narrow enough that a developer can understand a failure without studying an enormous suite.
Use this sequence:
- Choose one journey: Map the requests, dependencies, data, and business outcome.
- Define the service objective: Select percentile latency, throughput, error, and resource targets with product and engineering.
- Build a realistic script: Include the correct arrival model, pacing, transaction mix, authentication, and test data.
- Capture a baseline: Run a controlled test and save both the results and the exact environment configuration.
- Automate the feedback: Add a lightweight check to the delivery pipeline, then expand coverage as the suite proves reliable.
The first useful fix may be ordinary engineering work, such as an unindexed query or an unbounded loop. You don't need a complicated platform to reveal those problems. You need enough load to make the bottleneck visible, enough telemetry to locate it, and a retest that confirms the change helped without creating a new issue.
Choose automation architecture with the same care you apply to workload design. This guide to choosing a test automation framework can help your team evaluate maintainability, coverage, and CI/CD fit before the suite grows.
Performance testing in software is ultimately a conversation between user expectations and system behavior. Start with the risk that matters most, measure the slow tail rather than only the average, and keep the checks close enough to development that the team can act on them.
AskYourQA designs and implements performance testing systems that model critical user journeys, exercise APIs and frontends under realistic load, and analyze response times, throughput, errors, and bottlenecks. Visit AskYourQA to discuss a practical performance strategy and CI/CD checks that give your team high-signal feedback before release.