
Defect escape rate is production defects divided by all confirmed defects, times 100. Twenty production defects out of 200 total defects is a 10% escape rate.
If a team finds fewer bugs before release, does that mean the product is safer? A quiet test cycle can mean the checkpoints worked, or that nobody looked in the right place. Managers often treat a small pre-release count as proof of quality. That reading skips the defects customers find later, which is the part that changes support load and trust in the next ship.
The useful question is not how many bugs you caught. It is what share of the bugs you eventually confirmed first showed up after users had the build. That share only means something when everyone uses the same population, the same window, and the same discovery point.
Table of Contents
- What Defect Escape Rate Measures
- How to Calculate Your Escape Rate Step by Step
- Industry Benchmarks and Why They Vary
- Reading the Number Without Being Misled
- What Escape Rate Means for Release Readiness
- Root Causes That Let Defects Slip Through
- Automation Practices That Lower Escaped Defects
- Set Your Escape Rate Baseline Before the Next Release
What Defect Escape Rate Measures
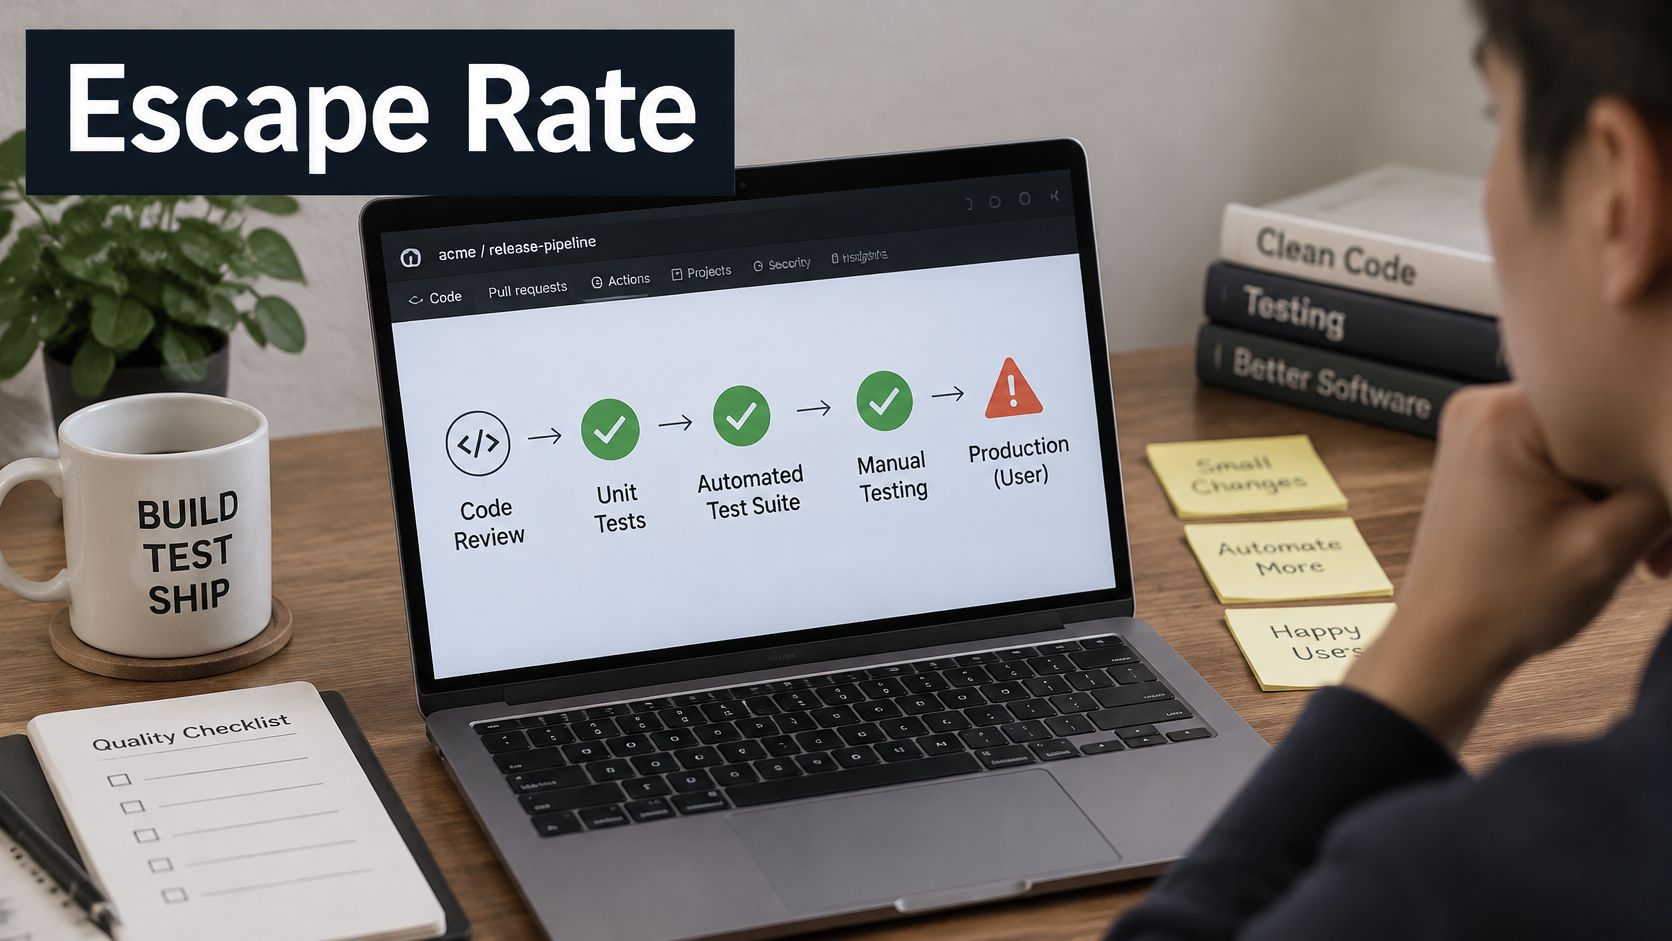
Picture a release moving through checkpoints: code review, unit tests, an automated suite, then a manual pass. A defect that clears every checkpoint and reaches a real user has escaped.
Defect escape rate is the share of all confirmed defects first found after release. The DevStats glossary of escaped defects writes it as production defects divided by pre-production defects plus production defects, then multiplied by 100.
Say a release logs 180 defects before it ships and 20 after. The total is 200. Twenty divided by 200 is 10%.
The two inputs
Pre-production defects come from reviews, tests, and staging checks. Production defects come from user reports, support tickets, and monitoring alerts that you later confirm as defects.
The count follows where the defect was found, not how severe it is. A critical bug caught in staging stays in the pre-production pile. A small typo a customer reports after launch is an escape. Severity still matters for triage, but it does not decide which side of the formula a defect sits on.
Use one population and one observation window, such as a single release, sprint, or month. That same glossary notes there is no universal benchmark, because acceptable levels depend on system risk, complexity, release frequency, and how thoroughly people report defects. Set a baseline and an improvement target. Do not treat an industry threshold as an SLA.
A rising rate means defects are bypassing one or more quality gates. The percentage will not name the cause. Incomplete requirements, weak test design, environment drift, flaky automation, thin regression, and a squeezed release can all push the same number up.
The rate shows how well checkpoints catch problems before customers do. It is most useful as a trend across releases counted the same way, split by critical journey, API versus UI, mobile versus web, and severity.
How to Calculate Your Escape Rate Step by Step
Pick the window before you touch a defect list. Mixing a quarter of bugs with a single release makes the percentage look calm or alarming for the wrong reason.
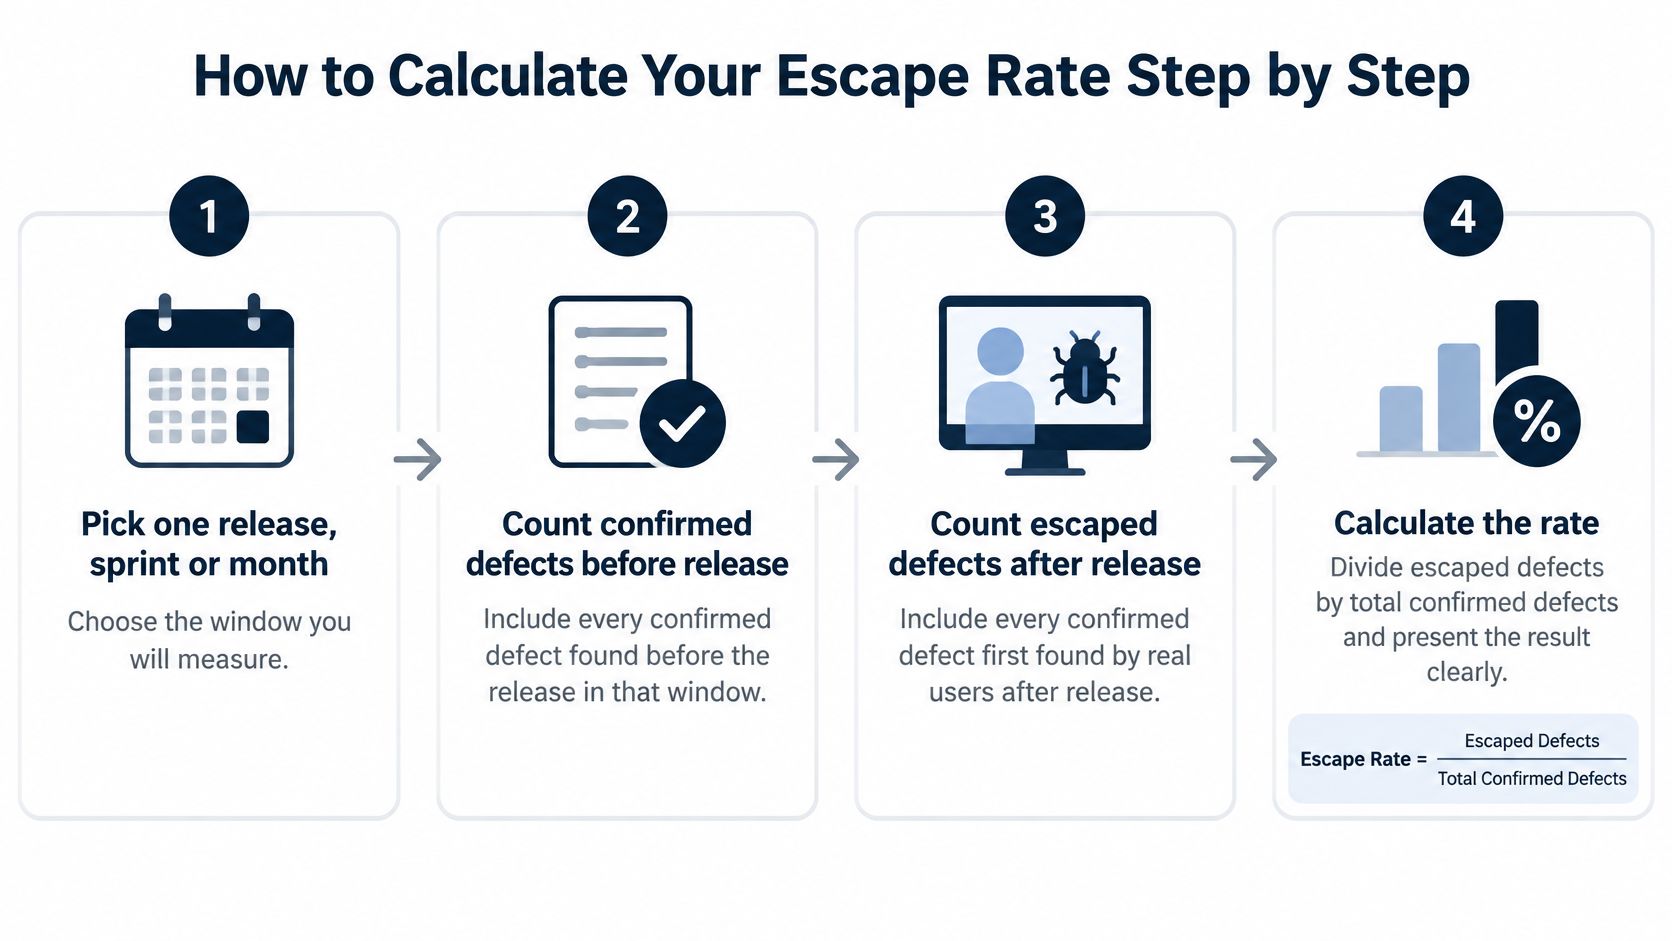
- Pick one release, sprint, or month. Write the start and end dates on the sheet. A shared window stops one team from counting a hotfix week while another counts a quarter.
- Count confirmed defects found before release. Include reviews, automated failures you accepted as defects, and staging finds. Skip duplicates and items you closed as not a defect.
- Count confirmed defects first reported after release. Use the same product and the same window. User reports, support tickets, and alerts count only after someone confirms them.
- Add the two counts. That sum is the denominator. Leave it visible so later readers can see volume, not only a percentage.
- Divide production defects by the total. Keep two decimals if the counts are large. Rounding a small sample to a whole number hides real movement.
- Multiply by 100 and store the rules. Record the window, what counted as confirmed, and who signed the sheet. A number without those notes cannot be compared next month.
Teams that also manage engineering work in the AI era already keep a shared board for ownership and dates. Put the escape-rate columns on that same board so the metric is not a side spreadsheet nobody updates.
Five scenarios, one formula
| Pre-release defects | Production defects | Total defects | Escape rate |
|---|---|---|---|
| 180 | 20 | 200 | 10% |
| 95 | 5 | 100 | 5% |
| 70 | 30 | 100 | 30% |
| 450 | 50 | 500 | 10% |
| 40 | 60 | 100 | 60% |
The first row is the familiar 10%. The second row, 5 out of 100, is 5%. The third, 30 out of 100, is 30%, a process that is letting almost a third of confirmed defects through. The fourth row is also 10%, but on 500 defects, so 50 customers or monitors still found a problem. The last row is 60% even though the total is only 100. A small backlog can still mean most defects are found too late.
Keep the same columns every release. Trends are comparable only when the sheet does not change shape between ships.
A short walkthrough of the arithmetic, from the two counts to the percentage, is easier to share with a release manager than a formula on its own.
Industry Benchmarks and Why They Vary
Why do published escape-rate benchmarks disagree so much? They are not measuring the same thing. Older quality literature uses defect removal efficiency, or DRE. Escape rate is the complement: if a team removes nine of every ten confirmed defects before release, one in ten escapes. That arithmetic is simple. The argument starts when teams compare the result to a published number.
| Benchmark pattern you will see | What it usually measures | Why it may not fit your team |
|---|---|---|
| A historical commercial-software average | Pre-release removal across a broad mix of products and release cadences | The population is wide, so your product, customers, and release window may not match it |
| A higher-performing organization band | Stronger detection and shorter feedback loops in mature teams | "Higher performing" depends on which defects were counted and when the window closed |
A benchmark number is a photograph taken with someone else's camera settings. It can show that a scene exists, but not whether your team is standing in it. A published benchmark may describe a mid-range commercial average or a stronger band for higher performers. It rarely shows the counting rules behind either figure.
The reason is governance, not statistics. A benchmark is only comparable when the change history is visible: which severity levels were included, whether late customer reports entered the window, and how long the release stayed under observation. A short release cycle and a long regulated release cycle can produce very different raw rates from the same quality process.
How to use the table
- Calculate three to five recent releases with the counting rules you already froze. One release is a story. A short series is a baseline.
- Compare the shape of your series, not just its position. Check the severity mix, the release window, and how customers report defects. A rate that moves after a severity definition changes is a governance change, not a quality change.
- Set a modest move from your own baseline. Copying a published band as a must-hit target ignores your product, your release window, and how customers report bugs.
Benchmarks are historical estimates, not constants. Product complexity, release window, severity thresholds, customer reporting, and how long you watch after launch all move the number. Ask instead whether your counting rules stayed identical while the rate moved. A falling escape rate signals stronger prevention and detection only when the change history is clean.
Reading the Number Without Being Misled
A low escape rate reads as strong quality at first glance. A small visible defect count can mean the test suite only found the easy cases. A release can close with a modest set of logged defects and still ship paths that its checks never exercised. The tidy percentage describes detection power as much as product health, and it cannot count defects the suite never had a chance to find.
A Tricentis guide to software quality metrics notes that published "good" lines are often stated too confidently, with some sources calling below 5% good and others calling below 10% strong, while definitions, populations, and release windows differ. A weekly SaaS release, a mobile app with staged rollouts, and a regulated enterprise release cannot share one raw rate.
Four ways the percentage moves without quality moving
Denominator drift. One period counts only critical defects. The next counts every ticket. The rate jumps or drops while the product stays the same.
Discovery lag. Defects reported weeks later never enter the figure until the window closes. Freeze the window before you publish the number, or late tickets rewrite history.
Severity blindness. Catching many trivial issues can pull the aggregate down while a few high-severity failures still reach users. Report escaped critical defects on their own line.
Release-model mix. Comparing weekly SaaS, staged mobile, and regulated enterprise releases on one percentage tells you about the calendar, not the gates.
A lower aggregate can conceal worse business risk when trivial issues are caught and a handful of severe failures are not.
Treat the percentage as a measurement-governance problem before you treat it as a coverage score. The more useful signal sits in the change history: are the same kinds of failures escaping release after release, and did the counting rules stay identical between those releases? The rules that make the number comparable are few, and they need to be written down before the review:
- Define what counts as a defect, including duplicates, environment-only failures, and third-party breaks.
- Freeze the observation window before the review meeting.
- Link production incidents and support tickets to a release, so escapes are not orphaned in the help desk.
- Segment by critical user journey and severity, and keep escaped critical defects visible.
A percentage without those definitions cannot guide a release decision. If you are choosing which numbers to sit beside this one, read the guide to quality software metrics for companion measures that keep the focus on decisions rather than a scoreboard.
What Escape Rate Means for Release Readiness
A release's own escape rate is final only after its observation window closes. The go or no-go call for the next ship has to lean on the trend from prior releases, plus proof that critical journeys were exercised.
A short readiness check
- Confirm every critical user journey has at least one passing end-to-end check on the build you intend to ship.
- Review escaped defects from the previous release and confirm each cause has a fix or a new test. An open cause with no test is the same hole, waiting.
- Check segment rates for critical journeys and high severity. A stable overall rate does not help if those slices are climbing.
- Record the gate results for this release: which suites ran, which were skipped, and who accepted a skip.
An open escape pattern on a critical journey triggers a hold or a limited rollout. A stable aggregate built mostly on trivial defects does not earn a green light by itself. Readiness also needs time to detect and time to remediate next to the rate. A slow fix on one escaped defect raises customer impact even when the percentage looks flat.
QA leads should report the rate with its counting rules attached. Product and release managers then read the same number, not two interpretations of a naked percent. Gates that run on every change, rather than the night before launch, are covered in our guide to CI/CD integration testing.
Root Causes That Let Defects Slip Through
Most escapes trace to a handful of causes. The fastest diagnosis is a warning sign you can see this week, then a check that takes an hour, not a new framework.
| Root cause | Warning sign | Quick check |
|---|---|---|
| Incomplete requirements | Stories reopened after sign-off | Compare acceptance criteria with real user flows |
| Weak test design | Bugs in flows that already have tests | Map each test to a critical user journey |
| Environment drift | Passes in staging, fails in production | Compare configuration and test data across environments |
| Flaky automation | Reruns hide failures | Quarantine and log flaky tests each week |
| Regression scope ignores change | Escapes in recently modified modules | Tie regression selection to change history |
| Release compression | Untested stories at sprint end | Compare test time per story with available time |
Start with requirements when stories keep reopening after sign-off. The test suite cannot catch a rule nobody wrote down. Weak test design shows up as bugs inside flows you thought were covered, which usually means the test hits a button and misses the decision the user makes. Environment drift is the staging pass that dies on production config or data. Flaky automation trains people to rerun until green. Release compression leaves stories with no test time at all.
Change history, not just coverage
Escape risk is often a change-history problem. A large empirical study of C and C++ and Java projects, summarized on arXiv, analyzed roughly 193,000 samples. Post-release defects were more associated with older, frequently modified, high-churn components and richer dependency histories than with code size or structural complexity alone. Escaped defects also tended to need longer, more complex fixes than defects found before release.
Adding a broad regression suite is not automatically the fix. Indiscriminate growth can miss the components whose history makes them risky, while the suite gets slower and noisier.
A stronger gate weights churn, component age, ownership changes, dependency coupling, incident history, and the journeys the business cannot lose. Then it picks targeted API, end-to-end, security, and performance checks for that slice. Track the escape rate beside risk-weighted escapes, time to detect, and time to remediate so a quiet aggregate cannot hide a slow, severe miss.
Automation Practices That Lower Escaped Defects
Automation helps when each practice closes a cause you already named. A larger suite that does not touch those causes only adds runtime.
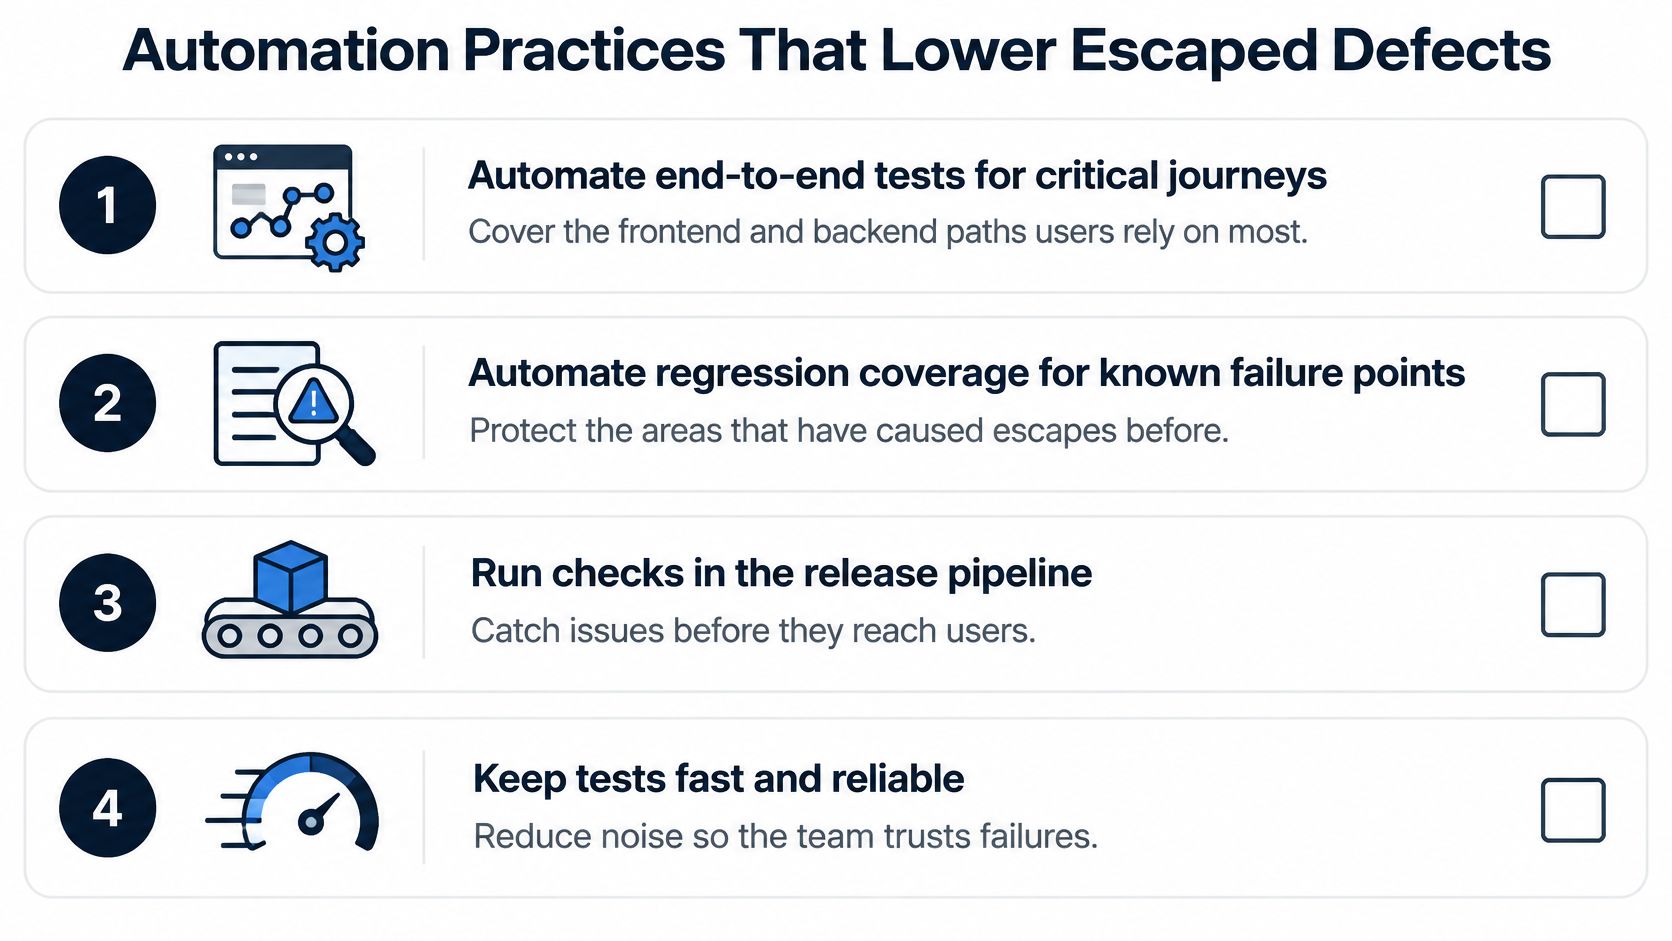
- Automate end-to-end tests for the few critical journeys. Cover frontend, backend, and mobile flows the product depends on, from start to finish, not isolated features. That is the direct answer to weak test design. Our note on what to automate in testing is a practical filter for which journeys earn a full path.
- Test APIs for contract and data. A broken payload should fail before a UI test times out. This catches environment drift and gaps that incomplete requirements left in the interface.
- Run smoke and regression on every pull request and merge. CI/CD gates block the bad change while the author still has the diff open. A nightly-only suite finds the same bug after three more commits have landed on it.
- Add security checks on critical flows early, and run performance checks before large releases. Security testing uncovers vulnerabilities, risky flows, and weak points before they become production incidents. Load and response-time checks belong on the same calendar as the feature, not the week after an outage.
- Select regression by risk. Weight recently changed and high-churn components. That is how you stop a regression scope that ignores change history.
- Keep the suite small and high-signal. Fewer, better tests that show whether the product works beat thousands of noisy checks. People act on a failure they trust.
- Quarantine flaky tests the week they appear. Log them, take them out of the blocking gate, and fix or delete them. A rerun culture is how escapes survive a green pipeline.
What the release checklist should show
Before you ship, the checklist should name three things: which critical journeys had a passing end-to-end run, which gates ran on the merge, and which changed components had a targeted check. If a row is blank, the escape risk sits in that blank, not in the overall pass rate.
Set Your Escape Rate Baseline Before the Next Release
Set the baseline before the next release, using the counting rules you already chose. A target with no baseline is a slogan.

- Fix the counting rules and the observation window on one page the whole release group can open.
- Calculate the rate for the last three to five releases with those rules, even if older tickets need a cleanup pass.
- Segment by critical journey and severity so a calm average cannot hide one broken path.
- Choose one segment to improve first. A checkout flow or a payments API beats a pledge to "lower escapes."
- Set the target as a change from your baseline, such as fewer escaped critical defects on that segment, not a borrowed industry percent.
- Review it at every release with the same columns. If the rate rises, name the gate that missed the defect and whether that journey had a test.
Name an owner for the metric, pick the first release you will measure, and put a date on the first review. AskYourQA offers a free 20-minute call in which we map your critical flows and show how fast an automation framework can be up and running.
AskYourQA designs test automation around the journeys that move your escape rate, from critical-flow mapping through CI/CD gates and release visibility. If you want a baseline you can defend at the next go or no-go, start with the flows customers feel first. Visit AskYourQA and book a working session on your next release.