
Your release candidate is green. Every automated test passes, the deployment finishes cleanly, and then support reports that customers using a supported browser can't complete checkout. Engineering asks how the tests missed it. Product asks whether to roll back. The dashboard answers neither question.
Useful quality software metrics help you make those decisions. They connect a customer risk to evidence, give someone responsibility for acting, and make it harder to improve the number without improving the product.
Table of Contents
- What Quality Means for Software Teams
- The Core Quality Metrics Catalog
- How to Map Metrics to Critical User Journeys
- Setting Targets, SLAs and Measurement Rules
- Vanity Metrics That Mislead and What to Use Instead
- Dashboards, Readiness Scorecard and Release Decisions
What Quality Means for Software Teams
A hospital judges care by patient recovery, not by how many lab tests it runs. Software teams need the same distinction: testing is an activity; quality is an outcome.
That doesn't make test results unimportant. It means you need to know what they represent, which risks they exclude, and whether customers experience something different.
The gap between a green pipeline and a usable product is where quality measurement begins.

Separate the outcome from the evidence
Use these complementary layers:
- Product quality asks, “Can customers accomplish what they came to do?” Think of the finished meal, not the kitchen checklist. Track defects, failed journeys, and the seriousness of their consequences.
- Delivery quality asks, “Can we introduce changes without disrupting customers?” Like transporting fragile goods, arrival matters as much as departure. Track deployment failures and restoration speed.
- Signal quality asks, “Can we trust the evidence we use to release?” A faulty thermometer creates bad decisions even when someone reads it carefully. Track flaky tests, unexplained reruns, and missing environments.
Incomplete testing isn't an unusual edge case. In 2025, 63% of surveyed global organizations reported shipping code changes without fully testing them, according to Tricentis's survey of 2,750 technology and software professionals across 10 countries.
You can't measure quality only at the release meeting. Developers need feedback during implementation, QA needs evidence on the release candidate, and service owners need production outcomes afterward.
A quality metric earns its place only if it changes a decision.
For each metric you adopt, name the decision, the owner, and the shortcut that could make the number improve without reducing customer risk.
The Core Quality Metrics Catalog
| Metric | Category | What It Tells You | How to Calculate |
|---|---|---|---|
| Defect density | Product quality | Defect volume relative to code size | Defects found ÷ thousand lines of code, or KLOC |
| Defect escape rate | Product quality | Defects discovered after release | Production defects ÷ all defects found × 100 |
| Test effectiveness | Test signal | How many known real defects the tests caught | Defects caught by tests ÷ all defects found × 100 |
| Mean time to recover, or MTTR | Delivery stability | How fast service is restored after failure | Total restoration time ÷ number of incidents |
| Change failure rate | Delivery stability | Share of deployments requiring remediation | Failed deployments ÷ total deployments × 100 |
| Change lead time | Delivery speed | Time from commit to production | Median elapsed time from commit to successful deployment |
| Flake rate | Test signal | Unstable outcomes without a relevant code change | Flaky results ÷ total runs, calculated per test |
| Critical journey pass rate | User experience | Health of important user paths | Passing journey runs ÷ total journey runs × 100 |
| p95 response time | Performance | Response-time boundary below which most requests finish | Sort request durations and select the 95th-percentile value |
Product and delivery measures describe different failure points. Defect density helps identify modules needing investigation. Change failure rate helps a service owner decide whether to tighten release controls. MTTR helps an incident lead decide whether to invest in detection, diagnosis, or rollback capability.
DORA's delivery metrics guide treats throughput and stability as complementary outcomes. Its failed-deployment recovery time is narrower than general incident MTTR: it concerns recovery from failed deployments, not every service incident. Don't combine those populations under a convenient label.
Read the formulas with their limits
Test-signal and experience measures explain whether the evidence is dependable and relevant. A QA lead can use flake rate to prioritize repairs. A product and engineering owner can use journey results to decide whether checkout is ready. A service owner can use response-time percentiles to investigate latency under a representative workload.
Be careful with p95. It's a boundary in the response-time distribution, not the average experience of the slowest requests. Record the endpoint, workload, environment, and measurement window alongside it.
Defect measures also need boundaries. Count unique confirmed defects, define the observation period, and separate severity levels. Test effectiveness measures the share of known defects caught, not the unknown defects still waiting to be discovered.
Carnegie Mellon's Software Engineering Institute summary of NIST findings reports that conventional testing identifies only about 25%–50% of defects. That historical finding explains why a strong-looking test result can't establish that the remaining product is defect-free.
Use code coverage to locate unexercised code, then investigate the assertions and risks involved. This guide to SonarQube test coverage provides context for interpreting that signal.
Treat the catalog like an instrument panel, not a shopping list. Start with a small selection that supports your current decisions, rather than installing every gauge and expecting clarity.
How to Map Metrics to Critical User Journeys
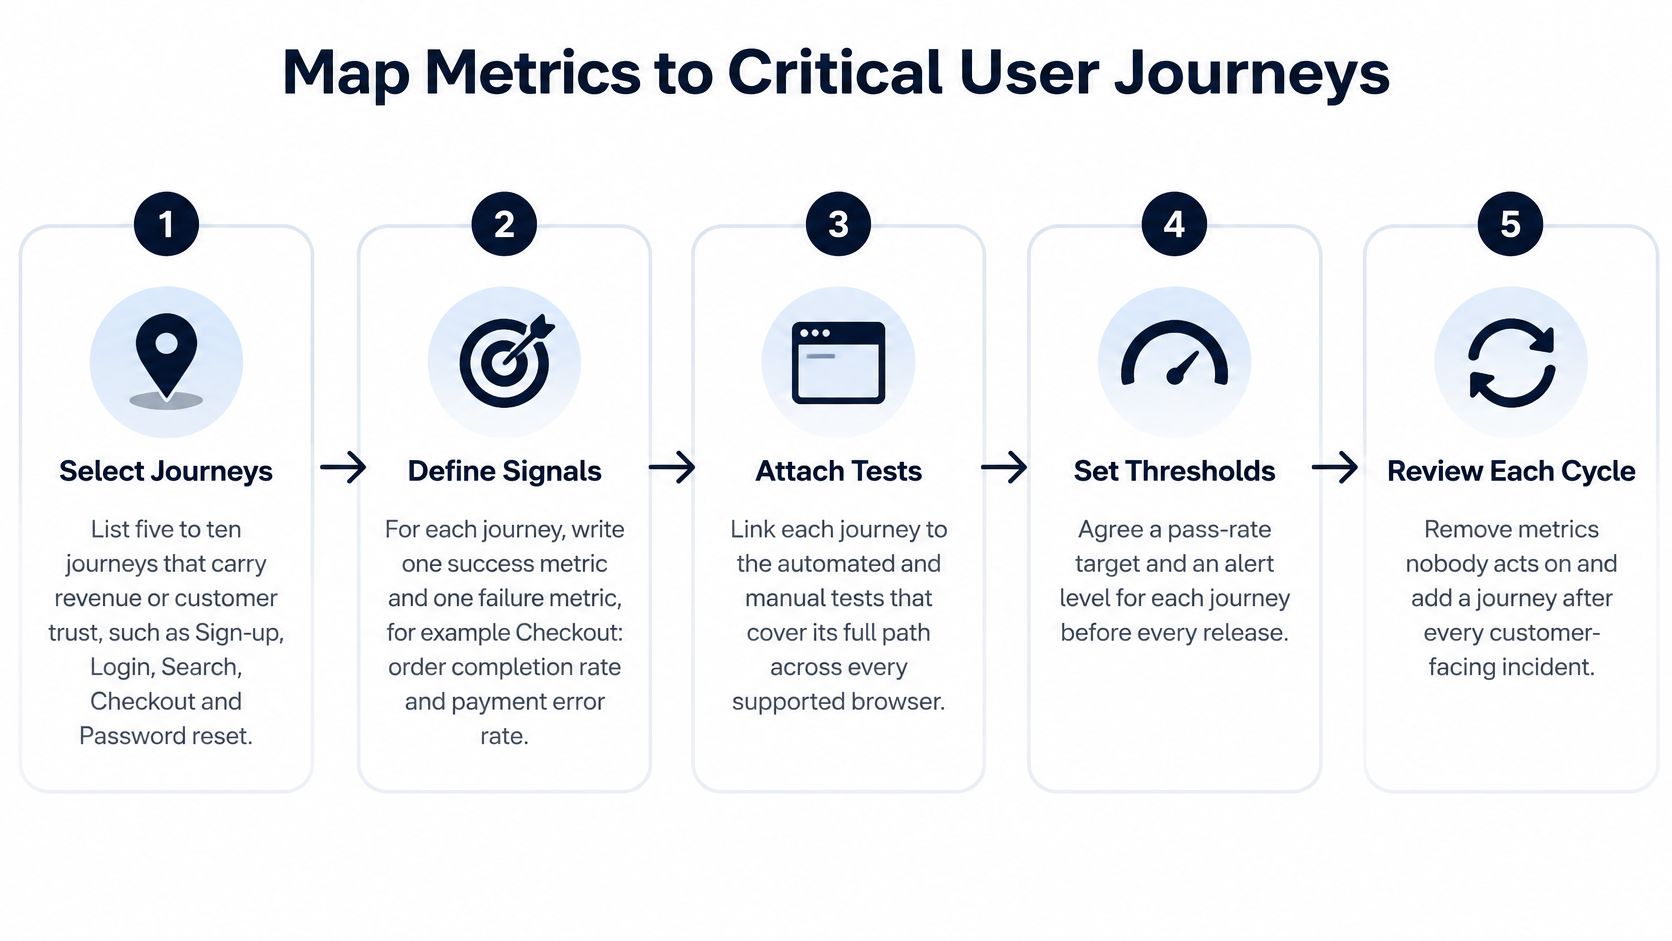
Start with something customers want to accomplish, not with your repository structure. Checkout crosses frontend code, payment APIs, inventory services, and confirmation messages. A dashboard organized only by component can miss the failure between them.
Think of journey mapping as planning a route: checking each vehicle separately doesn't prove the passenger can reach the destination.
Build a journey-to-decision map
-
Select the journeys that carry revenue or trust. List sign-up, login, search, checkout, password reset, and other paths your product depends on. For checkout, define the endpoint as a confirmed, correctly recorded order, not merely a successful button click.
-
Write the worst plausible failure. For example, a customer is charged twice after retrying a payment. This sentence gives reviewers a concrete risk to test rather than a vague instruction to check payments.
-
Choose where the failure should be caught. Test duplicate-charge prevention close to the payment logic, integration behavior at the API boundary, and the complete purchase flow through the supported browser environment. Add production monitoring for failures that depend on live conditions.
-
Attach metrics that change an action. Journey pass rate can block the candidate; payment-module escape rate can trigger a coverage review; payment-service MTTR can justify better recovery tooling. Don't attach every available metric to every journey.
-
Assign an owner and review date. Name the person who can coordinate changes across the journey, even when several teams contribute. Record when they'll review coverage, thresholds, and recent escapes.
The visual map helps keep customer outcomes connected to tests and monitoring.
Follow checkout through the release
For a hypothetical checkout release, run an end-to-end smoke test against the candidate with controlled payment data. Verify the order record, payment state, and customer confirmation, not just the confirmation page.
Track escapes against the payment module and recovery against the payment service. Otherwise, unrelated defects and incidents can obscure whether the checkout controls are improving.
Keep the reproduction package with the failure: browser version, account state, test-data identifiers, request traces, and build reference. In 2025, 84% of surveyed software development and testing professionals said reproducing defects with available test data was challenging, according to Applause's State of Digital Quality in Functional Testing report.
Use risk-based software testing to decide where deeper checks belong. A payment retry deserves different scrutiny from a cosmetic preference.
Don't map every screen into a separate executive metric. A screen is an implementation detail; a journey represents something a customer needs to finish.
Setting Targets, SLAs and Measurement Rules
| Metric | Starter Target | Example SLA Wording | Measurement Rule |
|---|---|---|---|
| Change failure rate | Improve against the service baseline | Breaching the agreed failure ceiling triggers a release-control review owned by the service lead | Count per service and release type |
| MTTR for critical incidents | Restore within the agreed critical-service recovery budget | Missing the recovery commitment triggers incident review and stakeholder notification | Start the clock at the first alert, not ticket creation |
| Defect escape rate | Reduce serious production escapes | Exceeding the agreed escape ceiling requires a corrective coverage plan | Attribute defects to the introducing release |
| Flake rate | Keep gate-suite noise below the agreed ceiling | Breaches require owner-led repair or controlled quarantine before reuse as a gate | Calculate per test ID and execution environment |
| Critical journey pass rate | Every mandatory journey passes on the candidate | A failed mandatory journey blocks release until resolved or explicitly approved through exception review | Log infrastructure outages separately; mark affected runs inconclusive |
| Change lead time | Improve the baseline without worsening stability | Missing the agreed small-change delivery commitment triggers a bottleneck review | Report median and upper-percentile lead time by change class |
These are starting rules, not universal benchmarks. A target is an improvement goal. An SLA is a commitment with a defined scope, measurement method, and consequence when missed.
Don't label an internal aspiration an SLA just to make it sound important. Customer-facing commitments need agreement from the people responsible for delivery, operations, and the commercial relationship.
Establish the baseline before negotiating the number
Collect a representative baseline across ordinary releases, busy periods, and incidents before choosing numeric targets. Separate services and change classes so a small configuration update isn't compared with a complex migration.
The baseline is like a medical history: it helps you interpret the reading, but it doesn't make an unhealthy condition acceptable. If customers already suffer serious failures, address the risk immediately rather than waiting for a tidy reporting period.
Avoid making coverage percentage the main target. In 2025, 14% of surveyed teams reported having more than 80% end-to-end test coverage, while test maintenance consumed 20% of team time, according to mabl's Testing in DevOps report.
Set expectations around protected journeys and useful feedback instead. A broader suite is worthwhile only when someone can explain which additional failure it catches and how its maintenance will be funded.
Write a measurement contract
Define the event, denominator, clock, exclusions, and owner in the dashboard documentation. Specify whether a hotfix makes the original deployment a failure, and avoid counting repeated reports of the same defect as separate escapes.
For recovery, distinguish restored customer service from completion of the permanent fix. For flaky tests, preserve the first outcome and rerun history instead of keeping only the eventual green result.
Also define what missing evidence means. An unavailable browser environment is unknown coverage, not a pass; an excluded infrastructure outage still needs an owner and an explanation.
Practical rule: Set the target after you understand the baseline, and document what would make an apparent improvement misleading.
Vanity Metrics That Mislead and What to Use Instead
When people optimize a measure instead of the outcome, they can improve the number while leaving the product worse.
That's the practical problem commonly described by Goodhart's law. A measure becomes dangerous when leaders reward it without checking how the team achieved it.
The concern isn't merely developer resistance to accountability. In JetBrains's 2025 State of the Developer Ecosystem survey of 24,534 developers, 66% said they did not believe, or were unsure, that current metrics reflected their real contribution.
Lines of code illustrate the mechanism. Research published in Information and Software Technology reports that developers using large language models can inflate lines of code by an average of 60.86%. A leader rewarding output volume could therefore encourage verbosity rather than safer changes.
Replace volume with evidence of protection
| Vanity Metric | Why It Misleads | Better Replacement |
|---|---|---|
| Number of automated tests | Counts volume, not what is protected | Critical journey pass rate and defect escape rate |
| Line coverage percentage | Executed lines can still contain untested logic | Coverage of critical journeys and high-risk modules |
| Lines of code written | Rewards verbose or generated code | Change failure rate and defects per change |
| Velocity or story points | Teams can adjust estimates without changing delivery | Change lead time read together with change failure rate |
| Deployment frequency alone | Frequent releases can still disrupt users | Deployment frequency paired with change failure rate |
| Overall pass rate | Can hide reruns, exclusions, and unstable results | Stable-test pass rate beside flake rate and excluded coverage |
Treat each metric like a scoreboard that someone might learn to exploit. Ask the owner how they could improve it without improving the customer outcome, then add the countercheck.
For example, a team could reduce reported escapes by classifying production bugs as support requests. Reconcile the defect register with support cases and incident records. A team could lower flake rate by removing unstable tests; inspect the lost journey coverage before calling that progress.
Keep useful diagnostics without turning them into goals
Raw test counts and static-analysis findings still help engineers understand their systems. They just shouldn't become stand-alone evidence of business value or individual performance.
Google's analysis of flaky-test root-cause localization treats flakiness as a technical problem requiring diagnosis. Apply that mindset operationally: quarantine should include an owner, repair record, expiry condition, and replacement coverage, not merely silence an inconvenient failure.
Ask, “If this metric doubled overnight, what would a customer notice?” The direction matters, and some improvements are preventive rather than immediately visible. But if you can't explain the connection to customer risk or delivery decisions, keep the number as an engineering diagnostic rather than an executive goal.
Dashboards, Readiness Scorecard and Release Decisions
Give leaders trends and give teams the detail needed to act. Don't force both audiences to interpret the same crowded screen.
The leadership view should show defect escape rate, change failure rate, MTTR, and critical journey pass rate over a consistent rolling window. Add agreed target bands, incident annotations, and sample counts so a movement isn't mistaken for a meaningful trend when little happened.
The illustration shows the layout, not recommended targets.
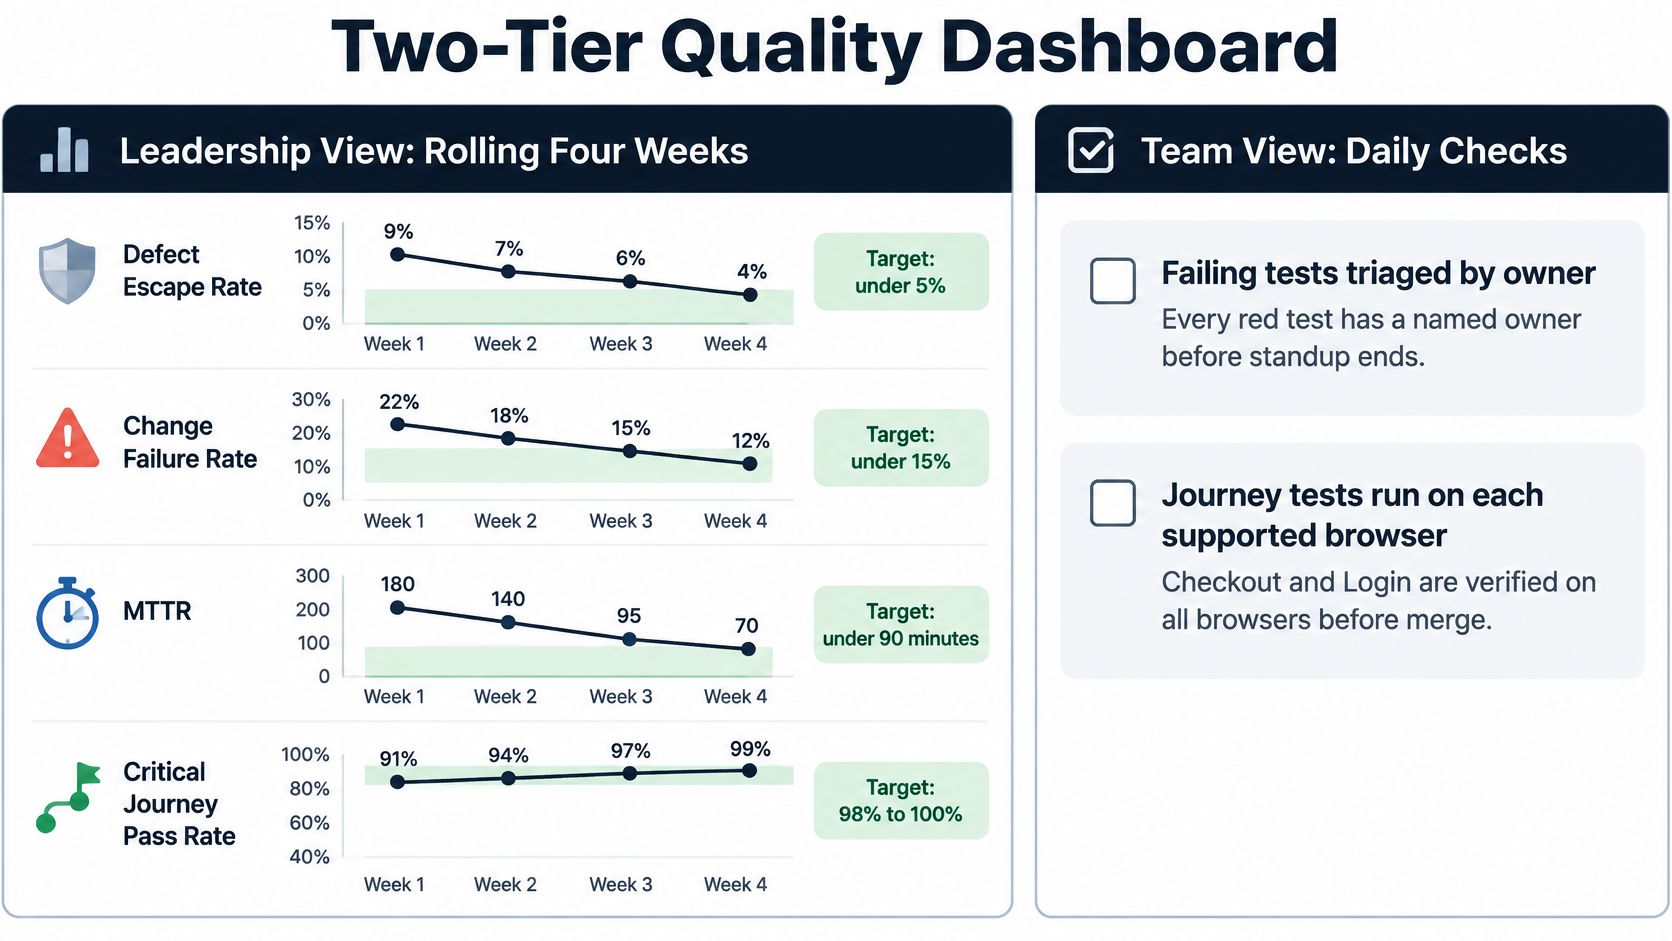
The team view should expose flaky test IDs, lead time by service, failing journeys with named owners, and unresolved critical defects. Connect each failure to its build, environment, logs, and triage record.
Choose test automation reporting tools around those drill-down needs. A polished chart isn't useful if the engineer can't reach the evidence behind it.
Make readiness an explicit decision
In 2024, reported use of automated quality gates ranged from 27% during development to 40% after product launch, according to JetBrains Qodana's State of Software Quality Report, based on responses from 808 technical professionals. Put a gate on the release candidate so teams inspect relevant evidence before customers encounter the change.
Use a readiness checklist:
- Mandatory journey smoke tests pass on the exact release candidate and required environments.
- No unresolved critical defects remain that violate the release policy.
- Gate-suite flakiness stays within the agreed limit, with exclusions visible.
- Recent deployment stability meets the service threshold, with unresolved regressions reviewed.
- Response-time percentiles fit the performance budget under the defined workload.
- Rollback or forward-recovery procedures have current test evidence, including data compatibility.
Don't turn this into an unweighted voting system. A broken checkout or unresolved security exposure can justify holding a release even when every other item is green. Lower-risk exceptions need a named approver, mitigation, expiry, and follow-up owner.
For AI features, extend the candidate evidence with versioned prompts, model configuration, reproducible evaluations, and unsafe-output checks. The 2025 DORA report announcement describes a negative relationship between AI adoption and delivery stability, a reason to examine release outcomes rather than assume faster code production means safer delivery.
This video provides additional context for discussing release evidence.
Put the system into operation
- Choose a small starting scope. Map your most important journeys and select metrics that change an actual release or investment decision.
- Collect a representative baseline. Agree definitions before negotiating thresholds.
- Automate evidence collection. Run relevant checks on pull requests and verify complete readiness on the release candidate.
- Record the decision. Hold a brief go-or-no-go review covering failures, exceptions, owners, and recovery options.
Teams without capacity to map journeys or integrate gates into CI/CD can use an outside QA partner. Judge that partner by the same evidence requirements.
Success is a release record that states which journey was tested, what the evidence showed, and who accepted the remaining risk.
AskYourQA designs and implements test automation systems, including critical-journey mapping, functional, AI, security, and performance testing, and CI/CD integration. Visit AskYourQA to discuss turning your release risks into high-signal checks and a readiness scorecard your team can act on.