
A checkout call that felt fine in staging starts timing out the week a campaign lands. The dashboard still shows a healthy average, so nobody raises a flag until support tickets pile up. That gap is exactly what a first serious round of performance testing for API work is meant to close. You are not chasing a vanity requests-per-second score. You are checking whether the journeys the business sells still meet agreed latency and error limits when traffic looks like a real peak, including rate limits and a dependency that is slow or down.
Table of Contents
- Set Latency and Error Targets Before You Test
- Pick Tools and Protocols for REST, gRPC and WebSocket
- Load, Stress and Scalability Tests Compared
- How to Build Test Data and Run the Test Safely
- Read Throughput, Latency and Bottleneck Signals
- Run Performance Tests in CI Without Slowing Releases
- Confirm Your Release Gate Before You Ship
Set Latency and Error Targets Before You Test
Performance testing measures speed, stability, and scalability under real-world load. Those three only mean something once each endpoint has a number you can fail a run against. Start from the five to eight journeys the product cannot lose, such as login, search, checkout, and an AI answer call. List the API calls each journey makes, in order, then give every endpoint a p95 target, a p99 target, an error-rate ceiling, and a peak requests-per-minute figure taken from analytics. Add about 1.5x headroom for growth so the gate is not already tight the week after launch.
Use this set as a starting point to adjust for your product, not as an industry standard.
| Endpoint type | p95 latency target | p99 latency target |
|---|---|---|
| Cached read (lookup by ID) | under 100 ms | under 200 ms |
| Login and token issue | under 400 ms | under 800 ms |
| Write or transaction call | under 400 ms | under 800 ms |
| Search or filtered list | under 500 ms | under 1 s |
| Async accept (webhook, job submit) | under 200 ms | under 400 ms |
| AI inference or LLM call | under 3 s | under 8 s |
A cached read under 100 ms at p95 is a fair bar. An LLM call that does real inference often needs a few seconds, so a 3-second p95 is honest rather than sloppy. Pair each row with an error ceiling, often under 1% for user-facing calls and tighter for payments, plus the peak rate from the last busy week.
Why the average is a bad gate
Averages hide the requests that time out and get retried. Google's speed research found that slowing the search-results page by 100 to 400 milliseconds over four- or six-week periods reduced searches per user by about 0.2% to 0.6%. In a separate experiment, an extra 200-millisecond delay meant 0.22% fewer searches in the first three weeks and 0.36% fewer in the next three. That study measured a web search page, not one isolated API, so do not copy those percentages onto your endpoints. The principle does transfer. Small delays stack across auth, database calls, rendering, and third parties, and a thin slice of slow requests hits a large share of journeys once concurrency is real. Put the budget in milliseconds, not in the word “fast.”
Before the first script runs, lock three things.
- One SLO row per endpoint: p95, p99, and an error ceiling.
- One peak load figure per scenario: taken from analytics, with 1.5x headroom.
- One named owner: the person who signs the targets and can change them.
Pick Tools and Protocols for REST, gRPC and WebSocket
The tool has to speak your protocol and fit the language the team already writes tests in. Everything else is secondary. A beautiful report from a client that cannot open a stream, or a script nobody on the team can edit, wastes the week you meant to spend on bottlenecks.
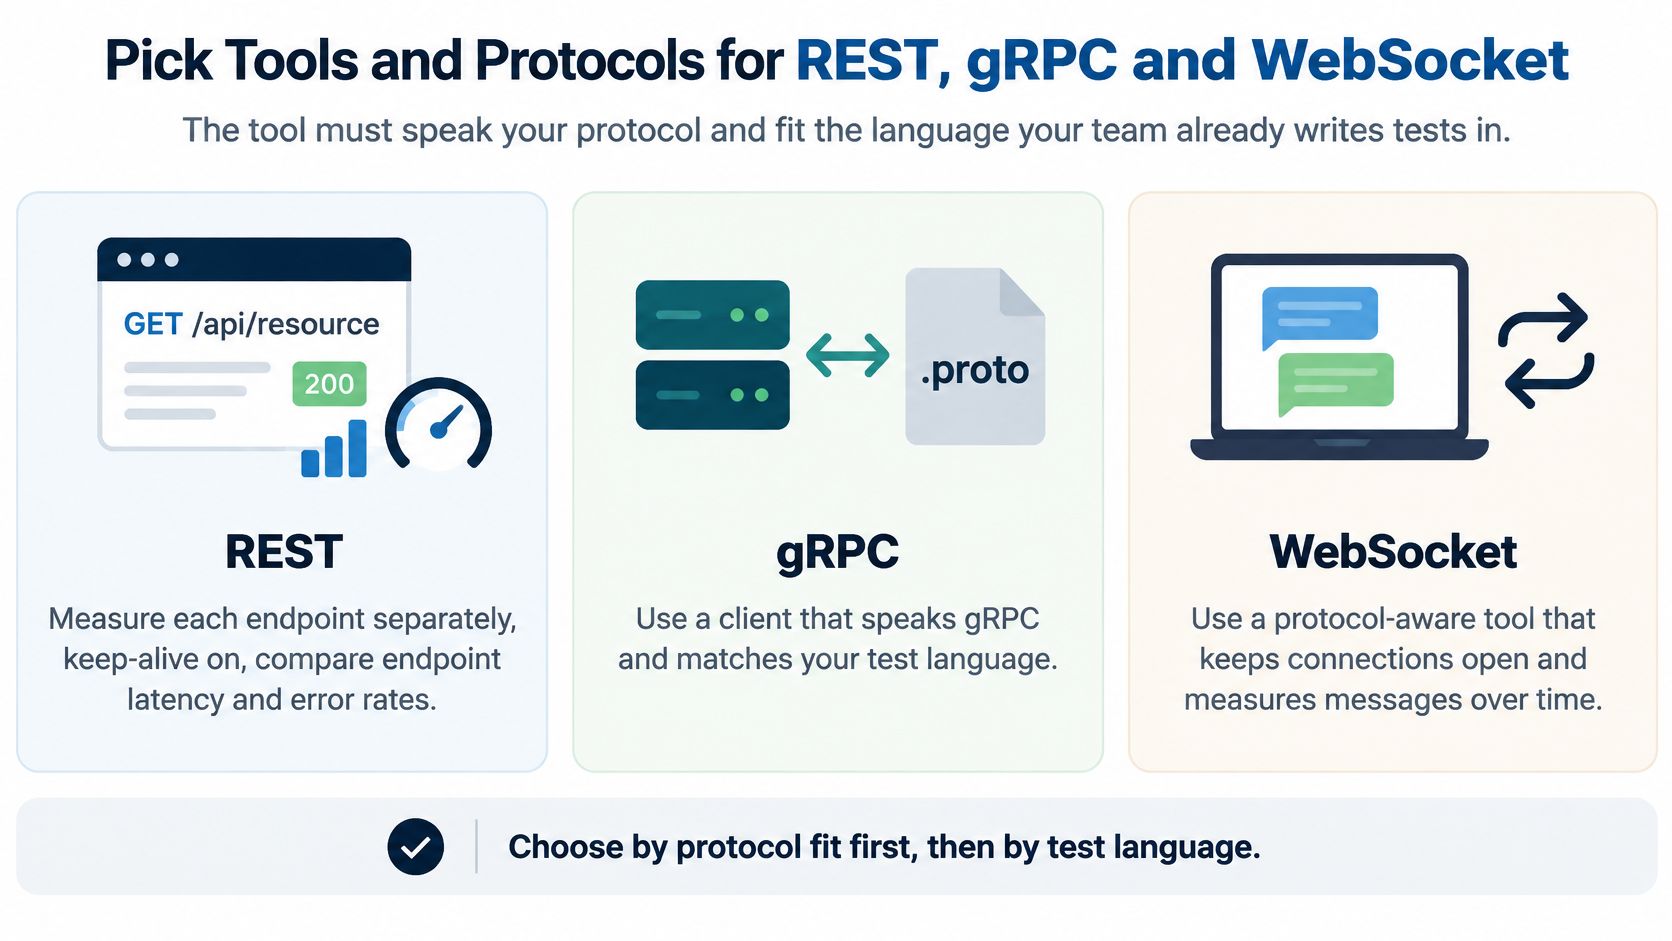
REST should be measured endpoint by endpoint with keep-alive on. If every request pays a fresh TCP and TLS handshake, you are timing the network setup, not the handler. gRPC needs a per-RPC view and a per-stream view. HTTP/2 multiplexing lets many calls share one connection, which can hide a connection-level limit until production fans out across more clients. WebSocket needs three counters: open connections, messages per connection, and round-trip time per message, plus memory held by an idle socket. A chatty socket that never closes will pass a short HTTP-style run and then exhaust the process overnight.
| Tool | Protocols | Scripting | Best fit |
|---|---|---|---|
| k6 | REST, gRPC, WebSocket | JavaScript | Script-first teams that run tests in CI |
| Apache JMeter | REST, WebSocket, gRPC (plugins) | GUI or XML | Teams that want a visual plan builder |
| Locust | REST, custom protocols | Python | Python teams with custom auth or client logic |
| Artillery | REST, WebSocket, Socket.IO | YAML or JavaScript | Quick HTTP and WebSocket scenarios |
| ghz | gRPC | Command line and JSON config | Focused gRPC RPC benchmarking |
Script versus a visual plan
A script in git is easy to diff, review, and fail a build on. k6, Locust, and Artillery live in that camp. JMeter helps a team that is new to scripting, because the GUI shows the plan, but XML plans are awkward to review and the runner is heavy on the load generator. ghz is the narrow case: one gRPC service, a quick benchmark, no journey to chain.
Practical rule: Pick one primary tool for the team. Add a protocol-specific runner only where that primary tool falls short, such as ghz beside k6 when a single RPC needs a tighter benchmark.
I would start with the language the on-call engineers already read. A perfect protocol module nobody will maintain is a worse choice than a slightly clumsier client the team will keep green.
Load, Stress and Scalability Tests Compared
One peak run does not prove an API is ready to ship. Each test answers a different question, and the load shape is what changes the answer. Match the question first, then the duration.
| Test type | Question it answers | Load shape | Typical duration |
|---|---|---|---|
| Load | Do SLOs hold at expected peak? | Ramp to expected peak and hold | 30 to 60 minutes at peak |
| Stress | Where does the API break? | Step load past peak until SLOs or error ceilings fail | 20 to 60 minutes |
| Spike | How does it handle a sudden surge? | Jump to 5 to 10x peak for 1 to 5 minutes | 10 to 20 minutes |
| Soak | Does memory or connection use climb? | Steady expected load | 4 to 12 hours |
| Scalability | Does throughput rise with added capacity? | Fixed steps with instance counts changing at each step | 1 to 2 hours |
A load test confirms the service-level objectives at the traffic you already expect. Stress finds the breaking point so you know the margin above peak. A spike imitates a marketing email or a flash sale. A soak is the only shape that exposes a connection leak, because a 40-minute run ends before the curve bends. Scalability steps both load and instance count. If throughput does not rise in a near-straight line, you have a shared bottleneck, not a capacity win. When you are choosing how to step instance counts, it helps to compare scalability testing tools against the protocol you run, rather than against a generic HTTP benchmark.
Quotas, bursts, and missing dependencies
Clean tutorials assume unlimited traffic and healthy downstreams. Production does not. A SmartBear trends white paper reports that 27% of surveyed engineering leaders wait for backend systems to become available and 38% see recurring delays from unavailable downstream systems, while 39% use fragmented tools across functional, security, and performance testing. The same industry compilation it cites found that 51.6% of API errors were HTTP 429 responses. Quotas, not slow code, often dominate the failure you will see.
Model burst and sustained traffic as separate profiles. A burst that is harmless when spread over an hour can trip a per-minute cap. Check that clients use exponential backoff with jitter, and watch retry amplification, where timeouts cause every client to send the request again and multiply the load. Run a short, statistically designed experiment before you pay for a large cloud test. If a dependency cannot be saturated safely, point the scenario at a contract stub that replays recorded latency plus 429 and 503 responses. In a second scenario, prove graceful degradation with timeout budgets, capped retries, and a fallback body. Count 429 and 503 responses per tenant, so one heavy customer cannot hide unfair throttling of everyone else.
How to Build Test Data and Run the Test Safely
A fast run against toy data is a false pass. Query plans, cache hit rates, and auth cost all change once the tables and the tokens look like production.
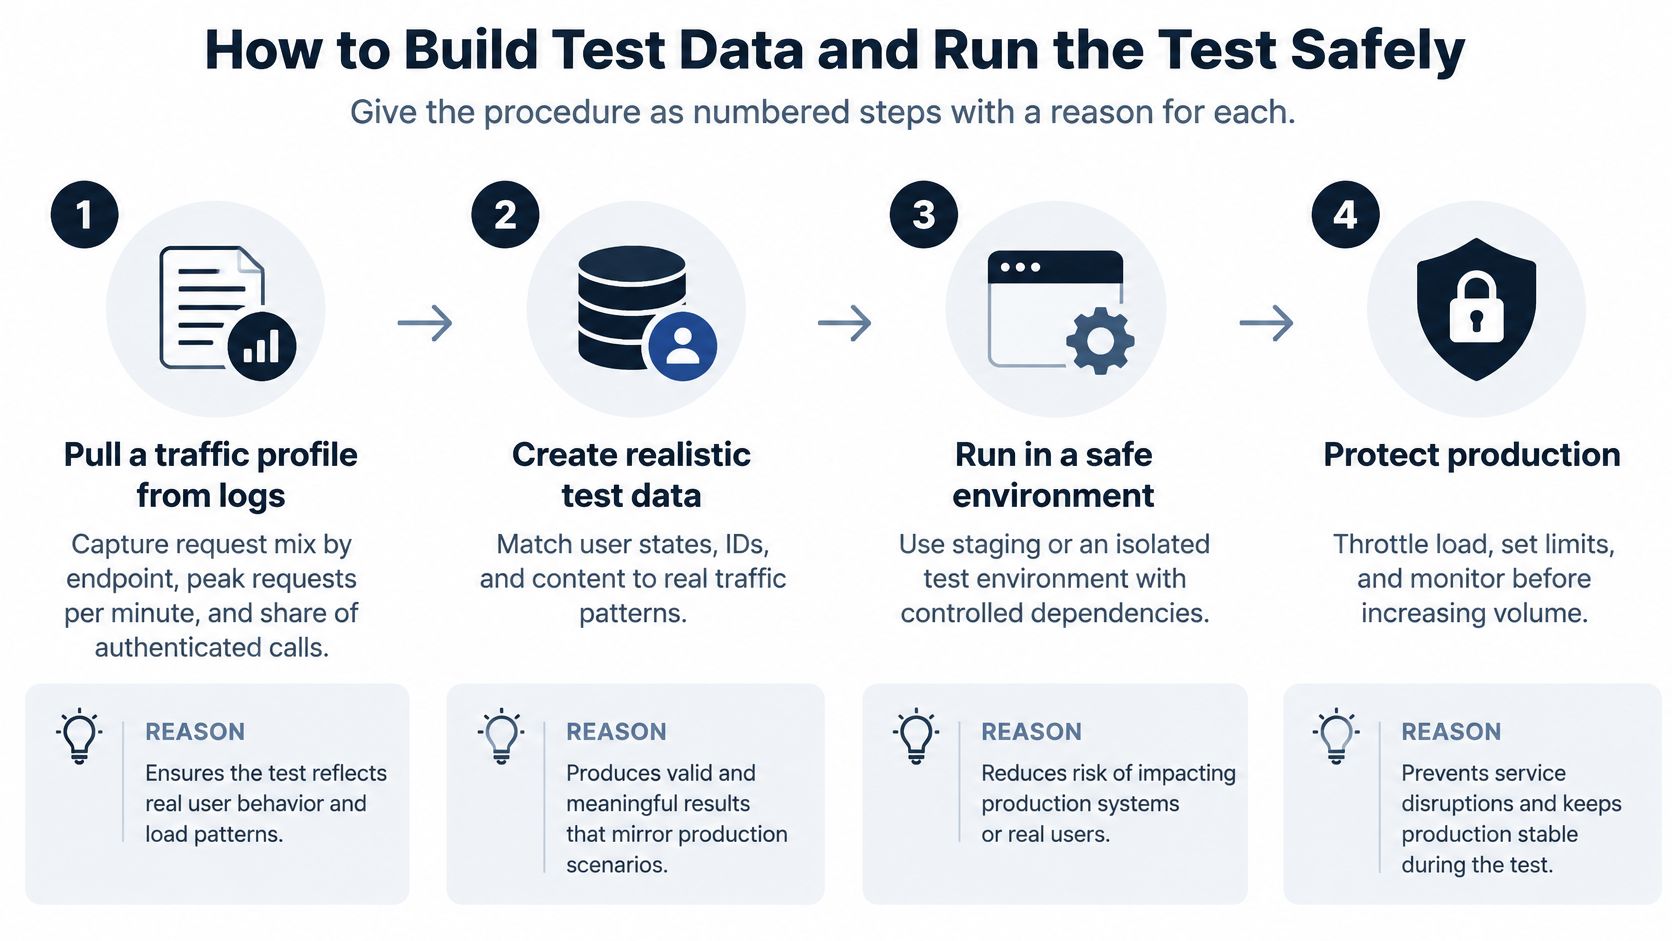
- Pull a traffic profile from logs. You need the mix by endpoint, peak requests per minute, and the share of authenticated calls. Without the mix, the generator hammers one route and ignores the journey users take.
- Create a pool of test accounts. For a mid-size product, about 500 to 1,000 accounts is enough that the run does not reuse one token. One hot token hits a cache production never sees, and latency looks better than it is.
- Seed data at production cardinality. Two million rows in an orders table behave differently from 500. Indexes, sorts, and lock waits only show up at real size.
- Match staging to production shape. Confirm, in writing, which dependencies are real, mocked, or rate limited. A sandbox whose quota differs from production is the slip that burns a week of “green” results.
- Warm up, then throw that slice away. Five to 10 minutes fills caches and connection pools. Keeping those samples in the report flatters the first minutes and hides the steady state.
- Save a baseline at expected peak. Later comparisons need a number from this environment, not from last quarter's laptop run.
- Ramp, then hold. Climb to the planned peak over 10 to 15 minutes and hold for 30 to 60 minutes. A vertical jump measures cold start and autoscaler lag, which is a spike test, not this run.
- Stop when the error ceiling breaks. Pushing on only fills logs. The failing minute is the evidence. The next twenty minutes are noise.
- Record the same five signals at every step. p95, p99, error rate, throughput, and resource use. If one is missing, you cannot tell a pool saturation from a slow query.
When you replay production traffic, strip personal data and tokens first, and ramp only as far as the partner quota allows. The Openbase API throttling docs are a useful model of how a host publishes per-minute caps and what a client should do when it is told to slow down. Burning a partner's daily allowance to “finish the test” is not a performance result. It is an incident you caused.
Read Throughput, Latency and Bottleneck Signals
Average latency is the number most likely to lie. Look at p99 first. If p99 climbs while p50 stays flat, a minority of requests are queuing, timing out, or stuck on one slow dependency. The median user still looks fine. The unlucky one percent is where retries start.

| Symptom | Likely bottleneck | First check | Usual fix |
|---|---|---|---|
| p99 rises while p50 stays flat | Slow dependency tail or lock contention | Slowest 1% of traces | Set timeout budgets and fix the slow query |
| Throughput flat, CPU under 50% | Full connection or thread pool | Pool wait time | Raise pool size and check for leaked connections |
| HTTP 429 rising with load | Rate limit or quota hit | Rate limit headers and quota dashboard | Add client backoff or raise the quota for tests |
| HTTP 503 at peak | Upstream saturation or slow autoscaling | Dependency CPU and queue depth | Add a circuit breaker and scale earlier |
| Latency grows in a straight line with users | Request queue building in the app | Queue length over time | Add capacity or shed low-priority load |
| Memory climbs over a soak run | Leak or cache with no eviction | Heap size over time | Fix the leak and set cache limits |
Flat throughput with CPU under 50% is almost never “the app is fine.” The pool is full, and new work sits in a wait queue that does not show up as CPU. Rising 429s are a policy signal, not a code defect, until you have confirmed the client is not retrying into the cap. A straight-line latency climb means the app is queueing inside the process. Adding users without adding capacity only lengthens that line.
Tracing can move the number you are measuring
Tail latency gets worse as calls fan out and as AI endpoints vary in how long inference takes. A Springer study of microservice APIs reported that instrumentation itself can cut throughput by as much as 8.4% in common cases and by 30% in extreme cases, with response-time degradation from 20% to 49% across more than 5,000 experiments on 70 microservice APIs. Measure the tail with tracing on and with tracing off. If full traces bend p99, use tail sampling in production so you keep the slow requests without taxing every call. For a failed run, keep the slowest 1% of traces. That habit separates a useful report from a pile of charts. When those traces cross services, improve reliability with application debugging by tying the slow span to the query or lock, then confirm the fix with a bottleneck analysis in performance testing rather than with another average.
The short walkthrough below shows how a latency chart and a request-count chart should be read together, not as two separate dashboards.
Run Performance Tests in CI Without Slowing Releases
One giant suite on every commit will either be skipped or will block the pipeline for the wrong reason. Use three layers.
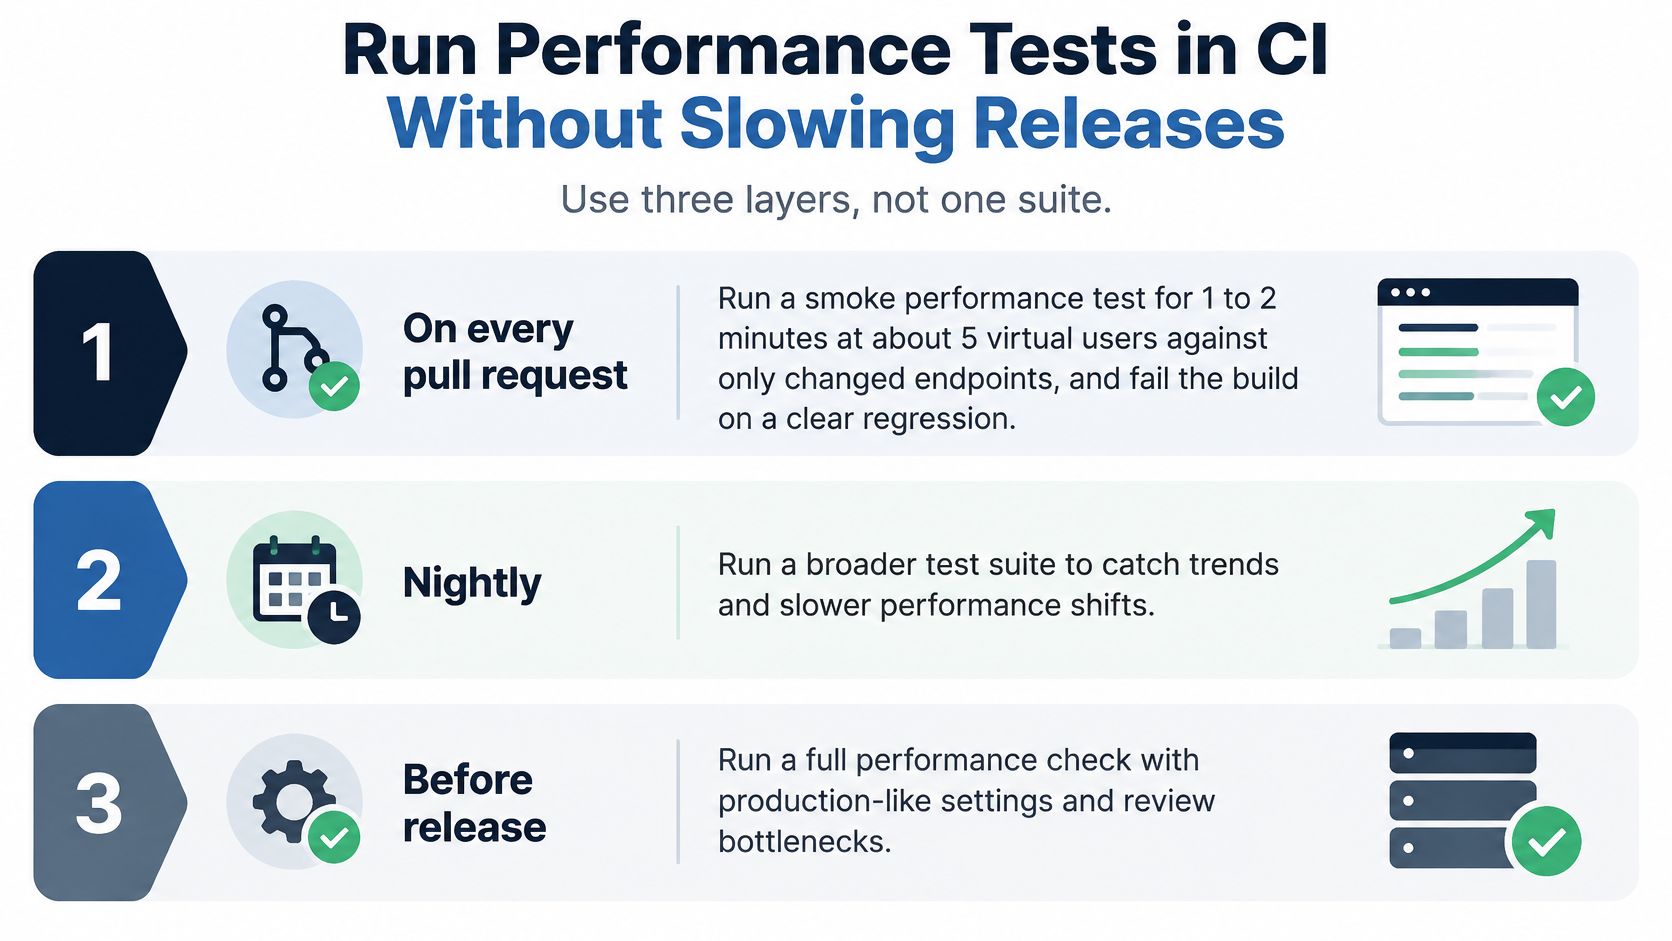
On every pull request, run a smoke performance test for 1 to 2 minutes at about 5 virtual users, and only against endpoints the change touches. Fail the build on a clear breach, such as p95 above target or an error rate above its ceiling. A two-minute smoke will not find a leak. It will catch a query that suddenly scans a table.
Nightly, run the full load scenario on staging and store the result as a baseline. That is where trend lives. A single green run tells you today was fine. Five saved runs tell you Tuesday has been getting worse.
Before a release, run stress and soak on a schedule the team can watch. Do not attach a 12-hour soak to every merge. Wiring this into the delivery pipeline is what CI/CD integration testing is for, so each release gets a fast signal instead of a manual checklist the night before launch.
Week one, then the drift rule
Keep thresholds in the test code so pass or fail is reviewable in git. For the first pipeline, stay small. A high-signal suite uses fewer, better tests that show whether the product works, instead of thousands of noisy checks. Week one is one critical journey, three SLOs, and one nightly run that follows a real user flow. Carry the same working list you already wrote: one SLO row, one peak figure, and one owner per scenario.
Compare each run with the last five baselines, and alert when p95 drifts by 10% or more. Slow drift is the failure most teams miss, because no single build looks broken.
Confirm Your Release Gate Before You Ship
Ship only when three conditions are true at once. Every critical endpoint meets its p95, p99, and error-rate targets at expected peak. The stress test shows a known breaking point with a safe margin above that peak. The soak shows flat memory and flat connection counts. If any one fails, the release waits. The failing row in the symptom table is where you look first, not a fresh brainstorm.
Targets without an owner drift. Name one person per row who can raise, lower, or defend the number when a feature needs more time.
This week, do three things and stop. Write the SLO table for the top five journeys. Turn on the pull-request smoke test. Schedule the nightly load run on staging, using the three-layer schedule above. That is enough to make the next release a gate instead of a hope.
If the team does not have the time or the specialist depth to stand this up, we offer a free 20-minute call in which we map critical flows and show how fast a performance testing setup can be running. For SenturoPay, a mobile banking app for cryptocurrency payments, we built performance testing to validate scalability and reliability alongside the backend and mobile automation. The same bar applies to a smaller API. Known limits, a named owner, and a run that can fail the build.
AskYourQA designs performance testing for API releases as a gate on latency, errors, and capacity, not as a one-off requests-per-second demo. We wire load, stress, and scalability checks into the pipeline so a slow dependency or a quota failure shows up before customers do. Visit AskYourQA and book the working session that maps your critical flows.