
Release week is rarely where bottleneck analysis starts. It starts when latency climbs, the API dashboard turns red, and someone points at the busiest service. The team adds instances, reruns the test, and discovers that the checkout journey is still slow because requests are waiting on a database lock, a downstream retry, or a saturated client connection pool.
That failure pattern is predictable. Bottleneck analysis in performance testing isn't a contest to find the highest utilization graph. It's a controlled attempt to prove which constraint causes the user-visible symptom, while ensuring the test tools and observability stack haven't changed the system you're measuring.
Table of Contents
- When the Slowest Service Is Not the Bottleneck
- The Controlled Loop for Production-Grade Analysis
- Metrics That Actually Point to a Bottleneck
- Tracing and Profiling for Causal Evidence
- Database and Backend Tier Diagnosis
- Why More Telemetry and More AI Can Become the Bottleneck
- Integrating Bottleneck Analysis into CI/CD and Pipelines
When the Slowest Service Is Not the Bottleneck
The release looked straightforward. A load test showed rising end-to-end latency, the order API reported high CPU, and its dashboard had the most alarming color. The obvious response was to scale the API tier. Capacity increased, but checkout latency barely moved.
A trace later showed that the API spent much of its time waiting for a database worker and retrying a downstream inventory call. CPU was a symptom of request handling and retry work, not the constraint limiting throughput. Scaling the API added cost and more concurrent pressure on the dependencies that were already struggling.

Correlation is not causation
A busy resource deserves investigation, but it doesn't prove that the resource is the root cause. High CPU can coexist with lock contention, queueing, downstream I/O, memory pressure, or a load generator that can't produce the intended workload. Low CPU can also hide a hard limit elsewhere, such as a connection pool or a serialized critical section.
A useful question is not, “Which component is slow?” Ask instead:
What changed in the causal chain between workload arrival and the user-visible delay?
That question forces the team to connect client-side latency with server-side telemetry, traces, logs, wait events, and profiling evidence. A service may appear slow because it waits for another tier, while the actual origin sits several hops away.
More load can make the evidence worse
Adding traffic before forming a hypothesis often creates more queueing and retries. The system enters a different operating regime, and the new result becomes harder to compare with the original run. More dashboards can create the same problem when agents increase network, filesystem, allocator, or storage pressure.
A defensible finding needs a baseline, a defined workload, and a change that can be tested independently. Without those controls, the team isn't diagnosing a bottleneck. It's reacting to whichever graph looks most uncomfortable.
The Controlled Loop for Production-Grade Analysis
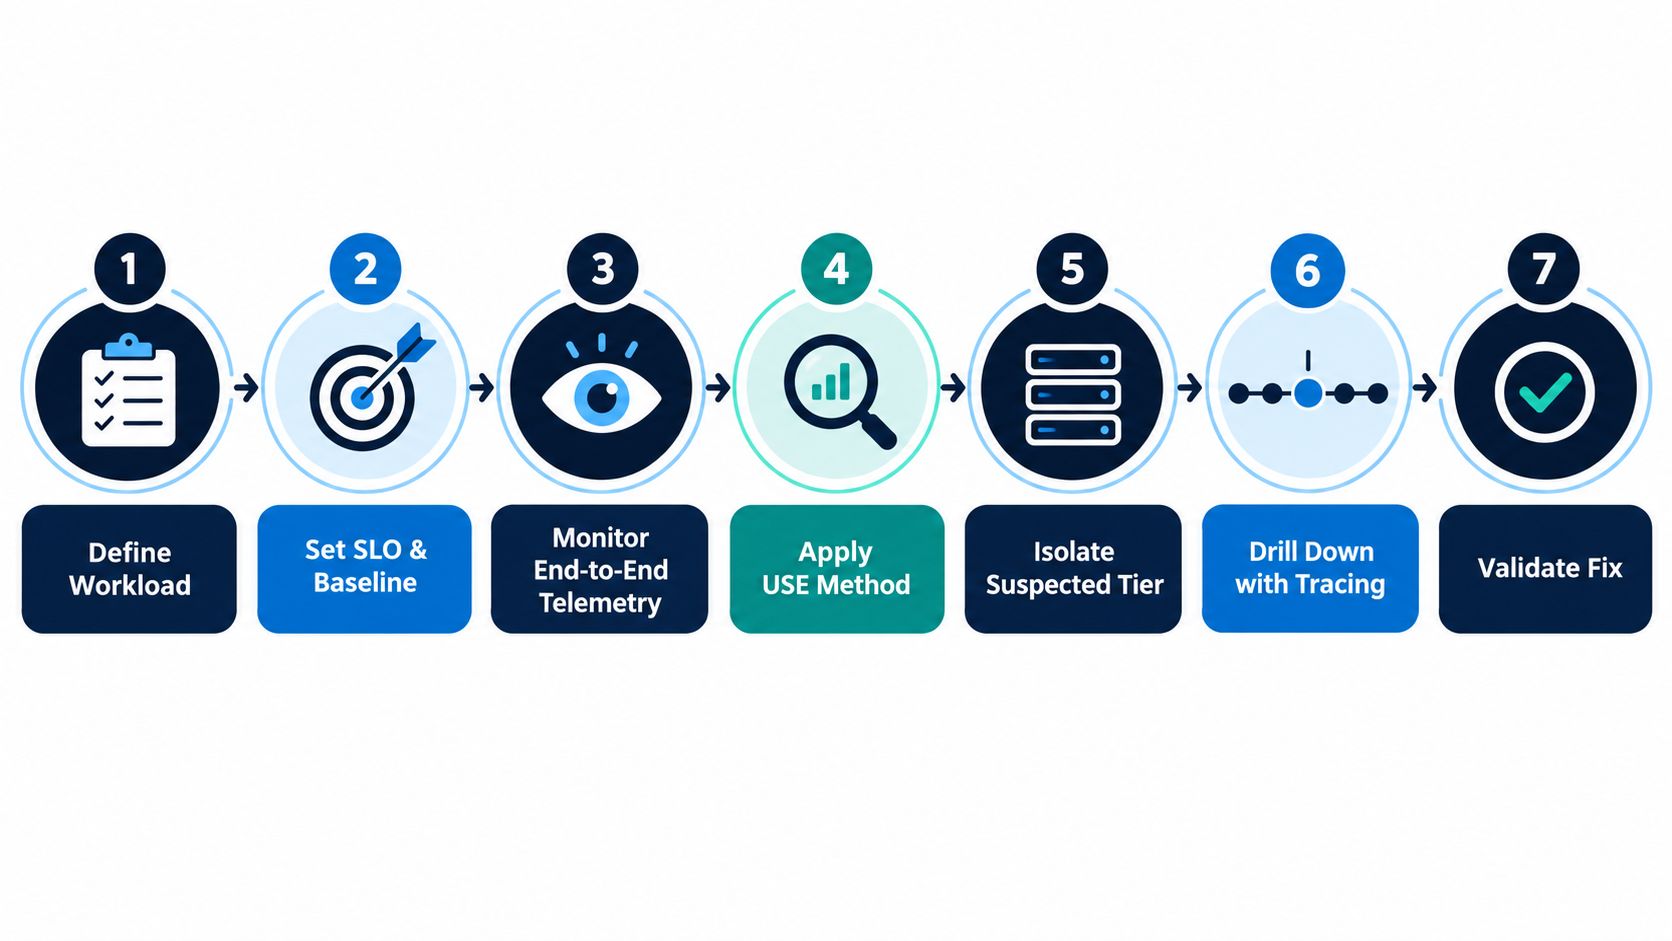
A reliable investigation follows a controlled loop described in the ACM Queue methodology for performance analysis. The sequence matters because each stage narrows the hypothesis without confusing a symptom for a cause.
Start with a workload you can repeat
- Define the workload. Specify the business journey, request mix, concurrency model, data state, ramp pattern, and expected throughput. A single endpoint rarely represents a real transaction path.
- Set the service-level objective and baseline. Record end-to-end latency, throughput, errors, and relevant resource telemetry before changing anything. Include percentile latency, not only the mean.
- Monitor the whole path. Collect client-side results and server-side signals with synchronized timestamps. Capture the load generator's CPU, memory, network, and connection limits as well as the system under test.
- Apply USE to each resource. Check utilization, saturation, and errors for CPU, memory, disks, network interfaces, queues, connection pools, workers, and database resources.
- Isolate the suspected tier. Use traces, logs, dependency timing, queue depth, wait information, and service-level comparisons to determine where the delay begins.
- Profile the hot path or inspect waits. CPU profiling helps with computation. Wait analysis helps when the operation is blocked on locks, storage, memory, workers, or another dependency.
- Change one variable and rerun. Keep the workload, data volume, concurrency, duration, and environment consistent. A fix is credible only when the identical test produces a repeatable improvement without moving the saturation elsewhere.
Treat test duration as part of the method
Short runs can capture transient peaks rather than sustainable behavior. Include a warm-up period so caches, connection pools, database state, and application initialization reach representative conditions, then analyze a sufficiently long steady-state interval. A test that starts measuring during cold caches may diagnose startup behavior as though it were production capacity.
Before each run, record the build, configuration, dataset, workload version, environment shape, instrumentation settings, and test generator capacity. After each run, record the same client-side and server-side metrics, plus errors and downstream saturation. If those conditions change, call the result a new experiment rather than a comparison.
Practical rule: If you can't rerun the workload with the same conditions, you haven't isolated causality yet.
The loop also prevents a common mistake: assuming the busiest resource is the limiter. Queueing, lock contention, downstream I/O, and client-side load-generation limits can all produce high latency without making the visibly hottest service the root cause.
Metrics That Actually Point to a Bottleneck
A metric becomes useful when it connects a workload to a user-visible outcome and helps distinguish competing explanations. End-to-end latency, throughput, error rate, and resource telemetry form the core set, but none should be read in isolation.
Average latency is a summary, not a release decision. Queueing and contention usually affect the tail first, so p95 and p99 latency reveal degradation that an average can hide. Compare those percentiles with throughput and errors across the same steady-state interval. A rising tail with stable average latency often means that only part of the workload is hitting a contested resource.
Choose metrics by diagnostic question
| Method | Best for | Key signals | Limitation |
|---|---|---|---|
| USE | Infrastructure and resources | Utilization, saturation, errors | It shows resource pressure but may not identify the business operation causing it |
| RED | Services and request paths | Rate, errors, duration | It describes service behavior without explaining every underlying wait |
Use RED to establish what users and callers experience at a service boundary. Use USE to inspect whether a resource is busy, queued, or failing. Together, they create a stronger starting point than a CPU dashboard alone. The performance testing overview from AskYourQA also frames response time, throughput, and errors as core dimensions of testing rather than isolated infrastructure readings.
Read the shape, not just the value
A throughput plateau while offered load continues to rise suggests a capacity limit, but the next step is to identify which resource or queue causes it. An error spike with flat application CPU may indicate connection exhaustion, a network boundary, or a dependency failure. High CPU with no latency change may mean the system has spare capacity at that workload, or that the work is efficient but busy.
Break metrics down by endpoint, status code, tenant or operation class where appropriate, dependency, and test phase. Server-wide CPU averages can conceal a single hot process, while aggregate error rates can hide one failing journey. Keep the load generator in view as well. If it saturates first, the test is measuring the generator's limit, not the application's.
Tracing and Profiling for Causal Evidence
A trace turns “the checkout API is slow” into a timing tree. Look for the span where delay begins, then compare its duration with child spans and service-side wait data. The useful evidence is often in the shape of the tree: fan-out to many dependencies, retries that multiply work, serialized calls that could overlap, or a queue wait that precedes a short execution span.

Build an evidence chain
Suppose a request appears to spend most of its time in an inventory span. Don't stop there. Check whether the span represents computation, a connection wait, a downstream retry, or time blocked behind another request. Correlate the trace ID with logs, database sessions, lock graphs, queue depth, and infrastructure telemetry.
For CPU-bound work, a sampling profiler can expose the hot path without the distortion of inserting logging into every function. On Linux, a basic perf capture might look like this:
perf record -F 99 -p <pid> -g, sleep 60
perf report
For a Java service, async-profiler can produce a flame graph while the workload is running:
asprof -e cpu -d 60 -f cpu.html <pid>
eBPF-based tools can help when you need kernel, scheduler, filesystem, or network context alongside application stacks. The command is less important than the question. Profile the suspected interval, compare it with a baseline, and look for a repeatable concentration of samples in the same call path.
Watch instrumentation overhead
Tracing every request at full detail can increase network traffic, storage writes, serialization work, and agent CPU. Profilers and packet-level tools can also alter scheduling or shared-resource behavior. Large-scale bottleneck diagnosis research warns that measurement itself can overtax shared resources such as networks and file systems, so instrument deliberately.
Use representative sampling, bounded retention, and a defined overhead check. Compare a run with instrumentation enabled against a controlled run with the same workload and environment. If the telemetry changes latency, throughput, or saturation materially, treat the measurement configuration as an experimental variable.
The following video provides a visual introduction to flame graphs and profiling concepts:
A flame graph doesn't prove that the widest frame is the system bottleneck. It shows where sampled execution time accumulated under that workload. Combine it with trace topology and wait information before changing code.
Database and Backend Tier Diagnosis
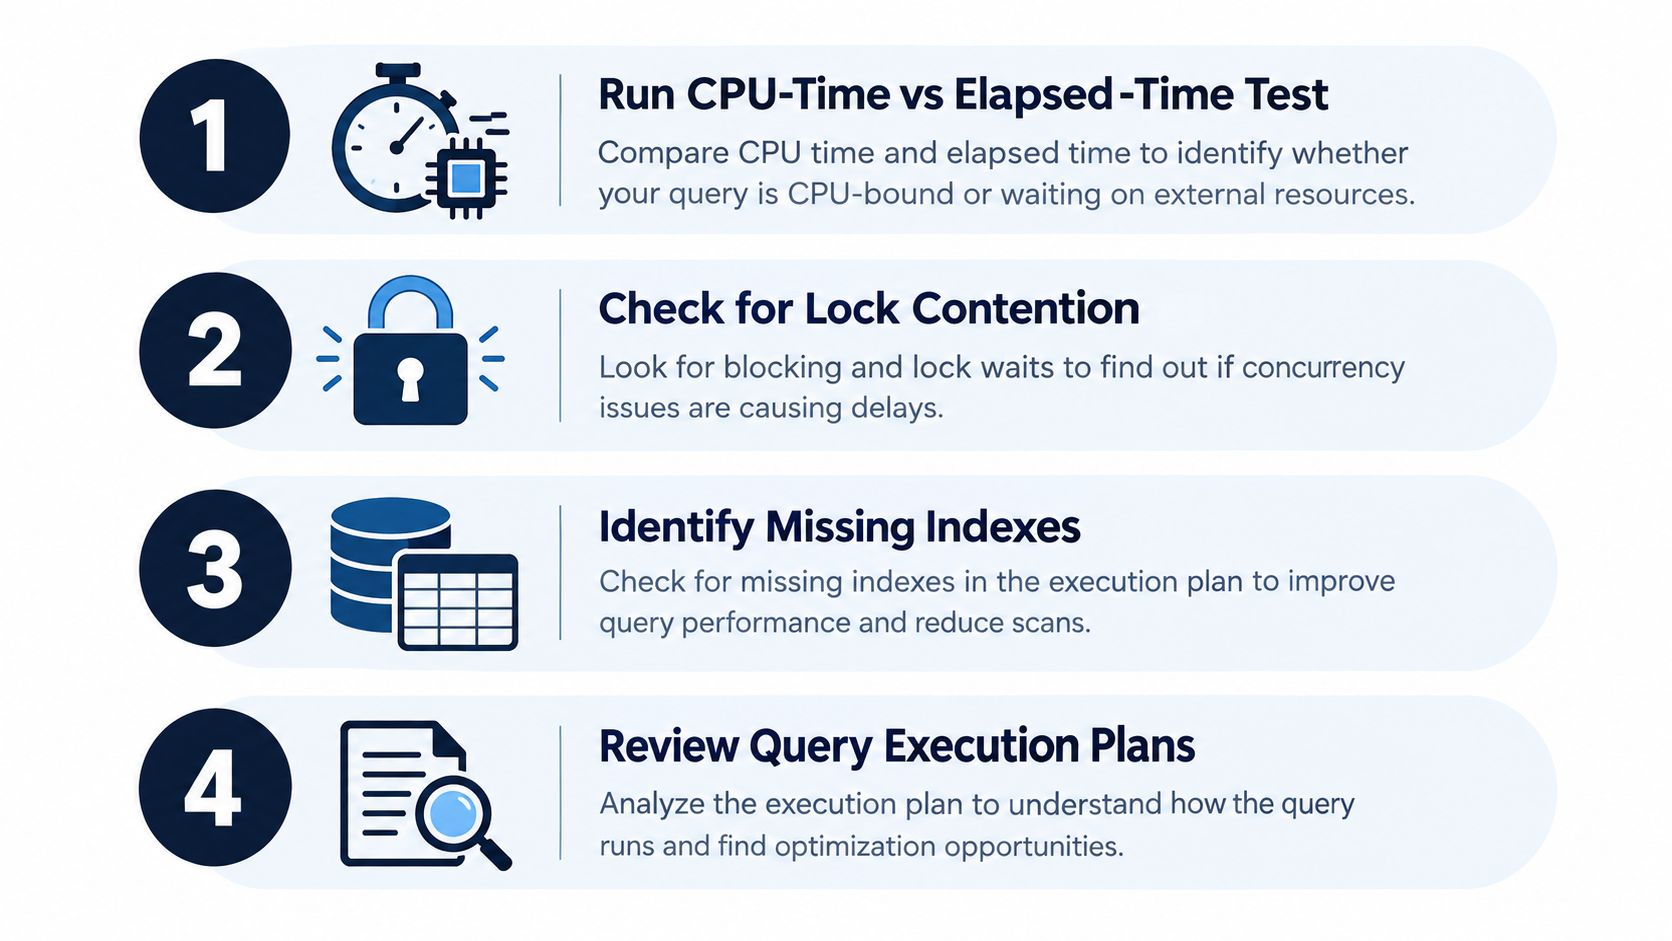
Database problems often look like application problems because the request thread remains occupied while the database waits. Start with a simple classifier: compare query elapsed time with CPU time. If CPU is approximately equal to or greater than elapsed time, the query is generally CPU-bound. If elapsed time is materially greater, the difference represents waiting for locks, storage, memory grants, worker availability, or another resource.
Test the queries that affect users
Don't begin with the slowest query in an administrative report. Select business-critical queries from the baseline, execute them under the same data volume and concurrency, and capture:
- Duration and CPU: Compare elapsed time with CPU time to separate execution work from waiting.
- Wait type and blocking: Identify locks, worker queues, storage waits, and memory pressure.
- Execution plan and I/O: Check scans, joins, estimates, spills, and excessive reads.
- Session context: Record concurrency, callers, transaction boundaries, and blocking relationships.
Rank queries by their contribution to user-visible latency. A moderately slow query called frequently can matter more than a very slow query on a rarely used path. The microservices testing guidance from AskYourQA is relevant here because dependency boundaries make it easy to mistake backend waiting for service execution time.
Remediate the actual wait
Lock contention calls for transaction review, shorter lock duration, improved access order, and appropriate isolation choices. Missing or ineffective indexes may require plan analysis and index design based on real predicates and joins, not blanket indexing. Memory grant issues need attention to cardinality estimates, query shape, and concurrent grant pressure. Worker queues may point to excessive concurrency, blocked workers, or a thread-pool configuration that doesn't match the workload.
Don't infer application capacity from server-wide CPU alone. Compilation, missing indexes, parallelism, disk pressure, memory pressure, maintenance, and ETL can all change CPU behavior independently of the user journey.
After one remediation, rerun the identical workload. Success means more than a lower mean. Look for repeatable improvement in p95 or p99 latency and throughput, with no increase in errors or newly saturated downstream resources.
Why More Telemetry and More AI Can Become the Bottleneck
Turning on another agent isn't the same as improving diagnosis. Observability should produce evidence that helps a team choose and verify an action, not merely increase the number of charts and alerts.
A 2025 cloud-native performance-testing review reported that organizations integrating observability with performance tests identified 76% of performance issues before production, compared with 31% among organizations with limited integration. The same review reported that combining all three traditional observability signals achieved 3.2 times higher bottleneck-identification accuracy than relying on only one or two signals. These figures support integration, not indiscriminate collection. The useful distinction is whether the signals are correlated and actionable.
AI deserves the same scrutiny. A 2025 observability forecast reported that 18% of surveyed participants considered AI and machine learning capabilities essential when evaluating observability solutions, while AI monitoring adoption reportedly rose from 42% to 54% year over year. That combination suggests active experimentation, not proof that automated root-cause analysis consistently beats well-designed thresholds and human-led experiments. The relevant test is whether an AI recommendation has traceable evidence and improves precision or time to diagnosis against a defined baseline.
Put economics inside the experiment
Observability cost can become an operational constraint. The same forecast described an enterprise example where annual observability costs grew from $50,000 in 2009 to $14 million in 2024, alongside roughly 40% yearly growth over 15 years. Those figures make sampling, high-cardinality labels, retention, privacy, and telemetry routing part of performance engineering rather than procurement details.
Use a decision framework before enabling an AI feature:
- Evidence: Can the recommendation point to traces, waits, logs, or profiles?
- Precision: How often does it identify a confirmed cause rather than a plausible symptom?
- Time to diagnosis: Does it shorten investigation compared with the existing process?
- Overhead: What CPU, network, storage, latency, and financial cost does it add?
- Reversibility: Can the team disable or narrow collection without losing essential coverage?
AI can prioritize anomalies across a large system, but it shouldn't bypass controlled validation. Keep a human-led experiment as the final check, especially when the proposed remediation changes concurrency, retries, sampling, or shared infrastructure.
Integrating Bottleneck Analysis into CI/CD and Pipelines
A bottleneck investigation becomes valuable when the next release can detect the same regression before users do. That requires a representative journey, stable test conditions, percentile-based budgets, and enough diagnostic telemetry to explain a failed gate.
A performance pipeline shouldn't attempt to simulate every production condition on every pull request. It should use a layered design, with fast checks for frequent feedback and deeper workloads at merge or release stages. The CI/CD pipeline guide from AskYourQA provides useful context for placing automated checks into pull request, merge, and release workflows.
Start with one journey
Choose one business-critical flow such as login and checkout, search and purchase, or document upload and processing. Define the expected request mix, test data state, concurrency model, and service-level objective. Include the complete journey where possible, because a single endpoint can pass while the sequence of calls, dependencies, and database writes fails under realistic contention.
Capture a clean baseline from a stable build. Store the workload definition, environment details, dataset version, test generator capacity, and observability configuration with the result. Without that context, a failed comparison may reflect a changed environment instead of a code regression.
Put percentile budgets in the pipeline
Use p95 and p99 budgets for user-facing journeys, plus throughput and error constraints. Absolute thresholds are useful when the environment is stable and the target reflects a real service-level objective. Relative deltas are useful when the test environment has normal variation, but they need a trustworthy baseline and a rule for repeated degradation.
A practical gate might evaluate:
- Journey latency: Reject a build when the agreed p95 or p99 budget is exceeded.
- Throughput: Require the workload to sustain the target rate without a throughput plateau caused by an introduced constraint.
- Errors: Fail on unexpected application, dependency, timeout, or connection errors.
- Resource headroom: Flag a build when CPU, memory, queues, workers, or database waits approach the team's defined limits.
- Diagnostic completeness: Preserve trace, log, and profile context for failed runs so engineers can investigate without rerunning blindly.
Don't average precomputed percentiles from separate load generators or time windows. Merge raw distributions or suitable histograms, then calculate the percentile across the full run. Otherwise, a pipeline can report a mathematically misleading result and approve a regression.
Use different stages for different questions
A pull-request test should be short and deterministic. It can exercise a critical API path with controlled data and modest concurrency, looking for obvious latency and error regressions. A merge-stage test can run the full journey with dependency behavior representative of the target environment. A release-stage test can include longer steady-state execution, broader concurrency, and profiling.
Synthetic checks in pre-production help validate repeatability. Canary comparisons in production help detect behavior that only appears with real traffic, data distributions, or dependency conditions. Keep those comparisons separate from pre-release gates. A production canary can reveal an issue, but it shouldn't become an excuse to skip controlled testing earlier in the lifecycle.
Keep the workstreams parallel
Teams lose time when framework design waits for every test case, or when pipeline integration begins only after performance scripts are “finished.” Build the workload model, test harness, observability contract, and CI integration in parallel. The first useful milestone is a thin vertical slice that can execute one critical journey, collect client and server evidence, and publish a decision-ready result.
When a gate fails, make the report answer four questions:
- What user journey regressed?
- Which percentile, throughput, or error budget failed?
- Where does the trace or wait evidence place the suspected cause?
- What changed between the baseline and the candidate?
That format stops the pipeline from becoming a blunt pass or fail mechanism. It turns a failed build into a bounded investigation.
Give the team five moves
A CTO, VP of Engineering, or Head of QA can start with this sequence:
- Define one business-critical journey. Write down its workload, data assumptions, and service-level objective.
- Capture a clean baseline. Include percentiles, throughput, errors, resource telemetry, and test-generator health.
- Add percentile budgets to CI. Gate the journey on p95 or p99, throughput, and error behavior rather than averages alone.
- Run one controlled loop end to end. Form a hypothesis, isolate the tier, change one variable, and rerun the identical workload.
- Audit observability spend and signal quality. Review sampling, retention, cardinality, overhead, precision, and time to diagnosis together.
The discipline is deliberately unglamorous. It replaces release-week arguments about the loudest dashboard with repeatable evidence. Over time, the team learns which signals explain its systems and which merely consume attention, compute, and budget.
AskYourQA can design and implement performance testing systems around critical user journeys, including load, stress, scalability, response-time, and bottleneck analysis with CI/CD integration. Visit AskYourQA to discuss a controlled testing workflow that produces actionable evidence before release.