
It's release week. The dashboard shows a healthy average response time, but checkout starts timing out when the campaign traffic arrives. Engineering sees a fast application; customers see failed orders, and nobody can explain why the release passed.
A useful performance testing strategy prevents that disagreement. It sets a budget for each critical journey, covering tail latency, errors, throughput, and operating cost, then tests that budget under repeatable, production-like conditions. The release decision comes from evidence the team can defend, not a reassuring average.
Table of Contents
- The Test Types and Exit Rules to Set First
- Why a Fast Average Can Still Be Wrong
- Model the Workload Customers Actually Create
- How to Design the Environment and the Run
- Choose a Tool for the Workload You Modeled
- Read Results Against More Than Latency
- Decide What Ships After the Numbers
- Wire Performance Gates Into CI/CD
The Test Types and Exit Rules to Set First
A performance testing strategy is the written agreement on objectives, scope, conditions, and pass rules before anyone chooses a tool. Product defines which customer outcomes matter. Engineering and quality teams turn those outcomes into measurable limits, while platform owners confirm the infrastructure and cost constraints.
Start with a journey, not an endpoint. Checkout includes stock checks, payment authorization, order creation, and confirmation. An individual request can succeed while the overall purchase fails, so the test needs a business-level success check.
Give each test a different job
Use a service level objective, or SLO, to describe the expected service for a journey under named conditions. Define the measurement boundary too: server response time isn't the same as the time until a customer sees confirmation.
The distinction between expected load and overload matters. AskYourQA's explanation of what a load test measures is useful when stakeholders treat every performance exercise as a maximum-traffic contest.
Performance test types and exit rules
| Test type | Question it answers | Load shape | Deciding metrics | Exit rule |
|---|---|---|---|---|
| Load | Can peak traffic stay inside the SLO? | Forecast peak held for the full planned window | Journey p95, error rate, completed throughput, saturation | SLO held for the full planned window |
| Stress | Where does it break and how does it fail? | Ramp past capacity until saturation or errors | Breakpoint, failure mode, recovery time | Breakpoint and recovery recorded; no silent data loss |
| Spike | Can a sudden surge be absorbed? | Short burst well above baseline, then back | Burst latency, error spike, recovery time | Returns inside SLO within the agreed recovery window |
| Soak | Do leaks or slow degradation appear? | Expected load held for hours | Memory and CPU trend, latency drift, error trend | No unbounded growth and no SLO drift over the run |
| Scalability | Does more capacity or more users scale cleanly? | Same journey at higher concurrency or more nodes | Throughput per node, saturation point, cost per transaction | Near-linear gain or a named bottleneck with an owner |
| Volume | Does production-sized data change speed? | Production-like records, cache, and payload sizes | Query time, I/O, journey latency | Critical journeys stay inside SLO at production data size |
Make the exit rule executable
Don't write “checkout must stay fast.” Record a latency ceiling with its unit, an error ceiling with its denominator, and a minimum rate of successfully completed purchases. Add the observation window and the recovery deadline.
For payments, distinguish a safe rejection from a lost or duplicate charge. Both may appear as unsuccessful transactions, but they require different release decisions.
A soak test must cover the lifecycle that could expose a leak, such as repeated connection reuse, scheduled jobs, or cache expiry. A brief smoke run can't establish long-running stability.
Practical rule: A test is ready to script only when someone else could read its exit rule and reach the same pass-or-fail decision.
Fill this table for a critical journey first. Select the tests that address its release risks, and document any deliberate exclusions rather than pretending every release needs identical coverage.
Why a Fast Average Can Still Be Wrong
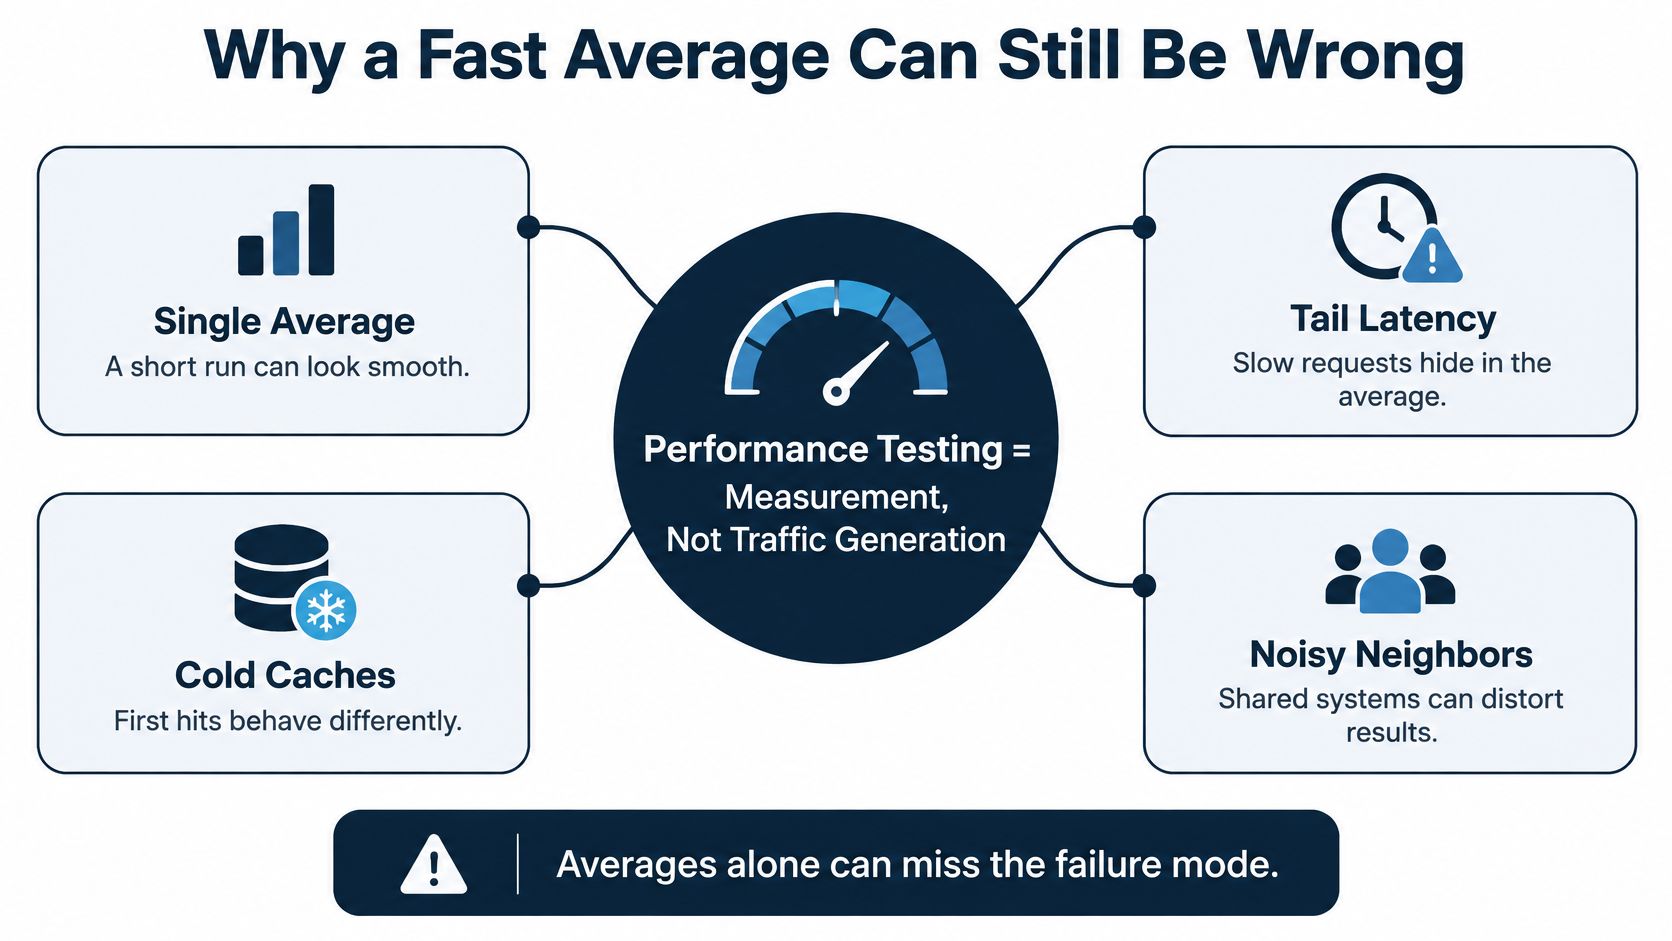
A short run can produce an excellent average while a slow group of requests waits behind a database lock. Frequent, inexpensive requests dominate the result, while customers trying to finish a purchase experience the delay. The arithmetic may be correct; the conclusion isn't.
Performance testing is measurement, not traffic generation. The NIST Software Performance Measurement project identifies small samples, limited instruments, inappropriate statistical software, violated assumptions, and inadequate uncertainty models as reasons apparently plausible results can be wrong.
Check what the chart actually measures
Think of a highway. A car's travel time doesn't describe the rush-hour pattern, and combining quiet periods with congestion can make the road look better than commuters experience.
In an application, tail latency describes the slower part of the response-time distribution. Report p95 per journey, and use p99 where the risk justifies examining a more extreme tail. Neither replaces the error rate: requests that fail quickly can make latency look better.
Inspect the collection path before trusting those measures:
- Timers: Confirm whether they include connection setup, network time, retries, and response-body transfer.
- Samples: Keep enough observations to characterize the journey, especially when it occurs infrequently.
- Failures: Preserve timeouts and cancellations instead of dropping them from reports.
- Aggregation: Check whether dashboards combine regions, transactions, or time windows that should remain separate.
Make comparisons fair
Say a candidate build appears faster than the baseline. If the candidate ran with warm caches while the baseline rebuilt them, the team hasn't isolated a code improvement. A quieter shared host, different container limits, or a changed autoscaling policy can create the same mistake.
Pin the build, configuration, and resource limits. Choose cache state deliberately, preserve raw request samples, and repeat comparable runs until the spread is visible. If the apparent improvement is smaller than the variation between runs, report the result as inconclusive rather than claiming a win.
A defensible conclusion names the workload and explains how latency, throughput, resource use, and failures changed, together with the uncertainty. It doesn't need elaborate statistical language, but it must distinguish observation from assumption.
No result enters the release meeting unless the conditions are named.
That includes limitations. If the test excluded a live dependency or used a smaller database, write that beside the result, not in a forgotten setup document.
Model the Workload Customers Actually Create
Requests per second is an output of the workload model, not the model itself. A generator can hit a throughput target while creating traffic no customer would produce. That proves the system handled the script, not that it will handle the release.
Use the workload discussion to bring product, platform, and quality engineers around the same customer behavior.

Build a journey mix from telemetry
Start with production telemetry and privacy-safe traces. Capture which journeys customers follow, how they pause between actions, and how much work continues after the visible response.
For a commerce scenario, most visitors might browse, a smaller group might purchase, and a thin slice might invoke an expensive AI assistant. Derive the actual proportions from your product instead of inventing a convenient even split.
Include these operating conditions:
- User behavior: Arrival patterns, concurrent sessions, think time, abandonment, and session reuse.
- Network and location: Regional round-trip delay, connection quality, and routing to dependencies.
- System state: Warm and cold caches, realistic payloads, background jobs, and data distribution.
- Failure behavior: Timeouts, bounded retries, unavailable providers, and degraded service paths.
An evenly distributed sweep of every URL won't reproduce that mix. A smaller suite covering search, login, checkout, and the expensive AI journey can be more useful if it represents the work that matters.
Treat geography and dependencies as scenarios
McKinsey's analysis of AI workloads and hyperscaler strategies describes inference placement near major metros as part of balancing latency with cost, sustainability, security, and regulatory constraints. For a release team, location therefore belongs in the test model rather than being a deployment footnote.
A nearby load generator won't expose every distant customer's network delay. Similarly, short AI prompts won't represent token-heavy requests, and a responsive provider stub won't expose timeout behavior.
Use this video alongside the team's discussion of how to execute the modeled traffic.
Test payment-provider failure and model-provider failure as explicit scenarios. Check what customers receive, whether queues remain bounded, and whether retries amplify the incident. Don't send unauthorized stress traffic to an external service; use approved sandboxes or controlled simulations.
Write the model on a page before selecting tooling or thresholds. Coverage means journeys and operating conditions, not endpoint count, and a plan containing only a target request rate isn't ready.
How to Design the Environment and the Run
A production-like environment doesn't have to be an exact production copy. It does need to preserve the characteristics relevant to the decision, with differences documented. If the database, networking, or scaling behavior differs materially, limit the conclusion accordingly.
Prepare a setup another engineer can reproduce
-
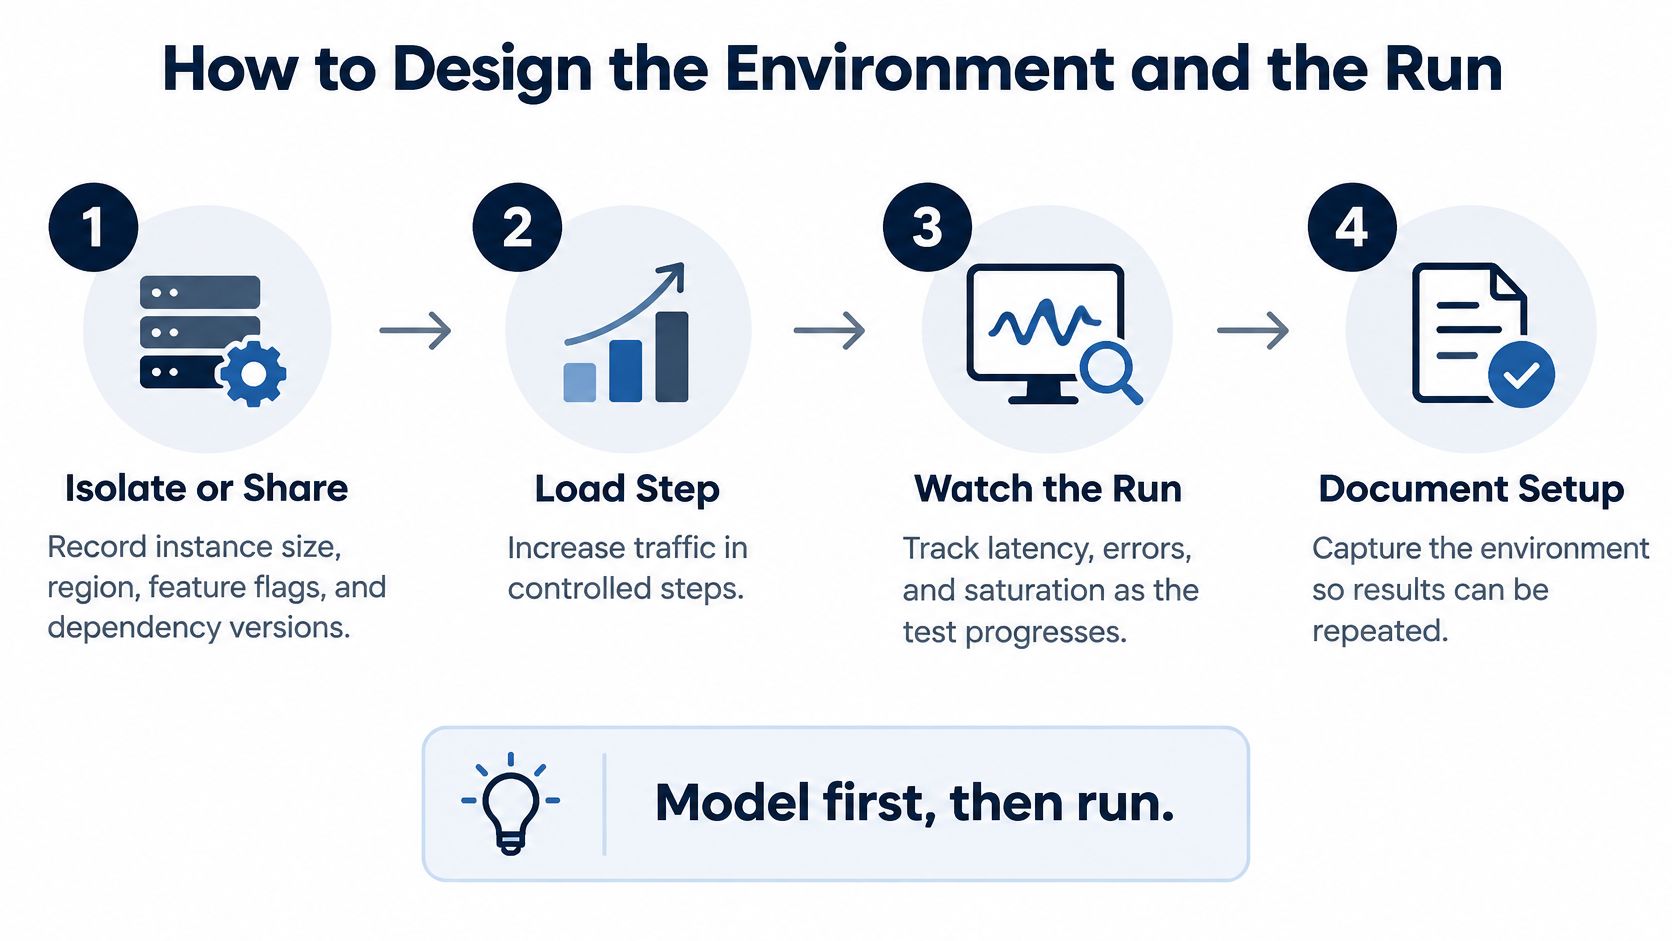
Choose isolation deliberately. Reserve the environment or record every shared workload. Capture instance types, region, feature flags, application configuration, and dependency versions. The usual mistake is calling staging dedicated while another team runs migrations.
-
Load representative data. Remove sensitive fields or synthesize records while preserving relationships, cardinality, and skew. A database with repeated placeholder values may exercise indexes differently from a real customer population.
-
Set cache and pool state. Use a cold start for restart behavior and a warmed setup for steady-state peak testing. Record connection-pool initialization as well. Don't let whichever engineer ran the previous test accidentally determine the conditions.
-
Script complete journeys. Add think time, realistic authentication, and valid business assertions. Tag transactions so checkout isn't averaged with health checks. Confirm that a successful response contains the expected outcome, not just an acceptable status code.
The setup and execution sequence should be visible to everyone reviewing the run.
Execute without confusing the injector with the application
-
Prove generator capacity. Place load generators outside the system under test and monitor their CPU, memory, network, and scheduling delay. If the injector can't create the intended arrivals, the application may appear to have reached capacity when it hasn't.
-
Ramp, hold, and ramp down. Increase traffic in controlled steps, hold each step long enough to observe behavior, and inspect recovery afterward. Repeat the sequence at higher loads so the result describes a curve rather than an isolated point.
-
Capture correlated evidence. Collect journey timings, traces, error classes, CPU, memory, connection pools, queues, and dependency time on a common timeline. Log retry attempts separately from original requests so amplification remains visible.
-
Archive the executable setup. Store scripts, data-generation rules, raw samples, configuration, and build identifier together. A screenshot is useful for discussion, but it isn't enough to reproduce a comparison.
Rate limits need special attention. A sandbox might throttle traffic before your application reaches its limit, while an unrealistic stub might remove the bottleneck entirely. Label which dependency behavior the run represents.
Entry check: Start a release-gating run only when the workload is agreed, data is loaded, telemetry is trusted, and generators are proven.
Assign someone authority to stop the test if it threatens shared services or corrupts the intended conditions. Continuing an invalid run only produces more invalid evidence.
Choose a Tool for the Workload You Modeled
Choose the tool by the traffic you need to reproduce and the team that will maintain it. Protocol support, custom behavior, geographic execution, and pipeline ownership matter more than a polished report.
A familiar tool is a reasonable default when it can express the model faithfully. Switching tools won't correct an unrealistic journey mix or missing success assertions.
Compare operational fit
Performance tools by the job they do well
| Tool | Best fit | Strong protocols | Pipeline fit | Usual limit |
|---|---|---|---|---|
| k6 | API and service scenarios owned by developers | HTTP, gRPC, WebSocket | Strong as code in CI | Browser-heavy workloads need separate capacity planning |
| Apache JMeter | Mixed protocols and teams that want a GUI | HTTP, JDBC, JMS, plugins | Possible, often heavier to maintain | Injector weight unless distributed |
| Gatling | High-concurrency HTTP written as code | HTTP and related code modules | Strong for code-first teams | Steeper for non-developers |
| Locust | Custom Python client behavior | HTTP and custom Python | Good if the stack is already Python | Scale needs a distributed run |
| Managed cloud runner | Geo-distributed or real-browser load | Broad, vendor-dependent | Hosted execution, less local control | Cost grows with concurrency, duration, and regions |
k6 suits JavaScript-based service scenarios and executable thresholds. It supports browser testing too, but protocol-level load doesn't reproduce rendering or client-side execution. Keep that distinction explicit when deciding what a passing run proves.
Apache JMeter is useful when the journey crosses a mixed protocol estate. Build and debug through its GUI, then run load execution without the GUI and unnecessary listeners. Distribute injectors when generator resource use starts limiting the workload.
Choose what the team can own
Gatling is a good fit when developers want code-reviewed HTTP simulations and control over high-concurrency scenarios. Teams uncomfortable maintaining code may find script ownership harder than initial execution.
Locust works naturally for Python teams modeling custom clients or unusual user behavior. Its flexibility is valuable, but distributed workers still need deployment, monitoring, and consistent configuration.
Managed runners such as BlazeMeter or LoadView become attractive when regional injectors or real browsers are central to the model. Check the specific service's browser and protocol capabilities, how it stores credentials, and whether it exports raw evidence before committing.
Use a short proof of fit:
- Express the hard path: Implement the journey with authentication, dynamic data, and business assertions.
- Inspect generator health: Verify that the tool sustains the intended arrival pattern.
- Test failure reporting: Confirm that timeouts, retries, and rejected transactions remain distinguishable.
Pick a default runner for pipeline smoke tests and a runner for full pre-release execution. They may be the same tool. Avoid maintaining overlapping suites because different teams started separate experiments.
Read Results Against More Than Latency
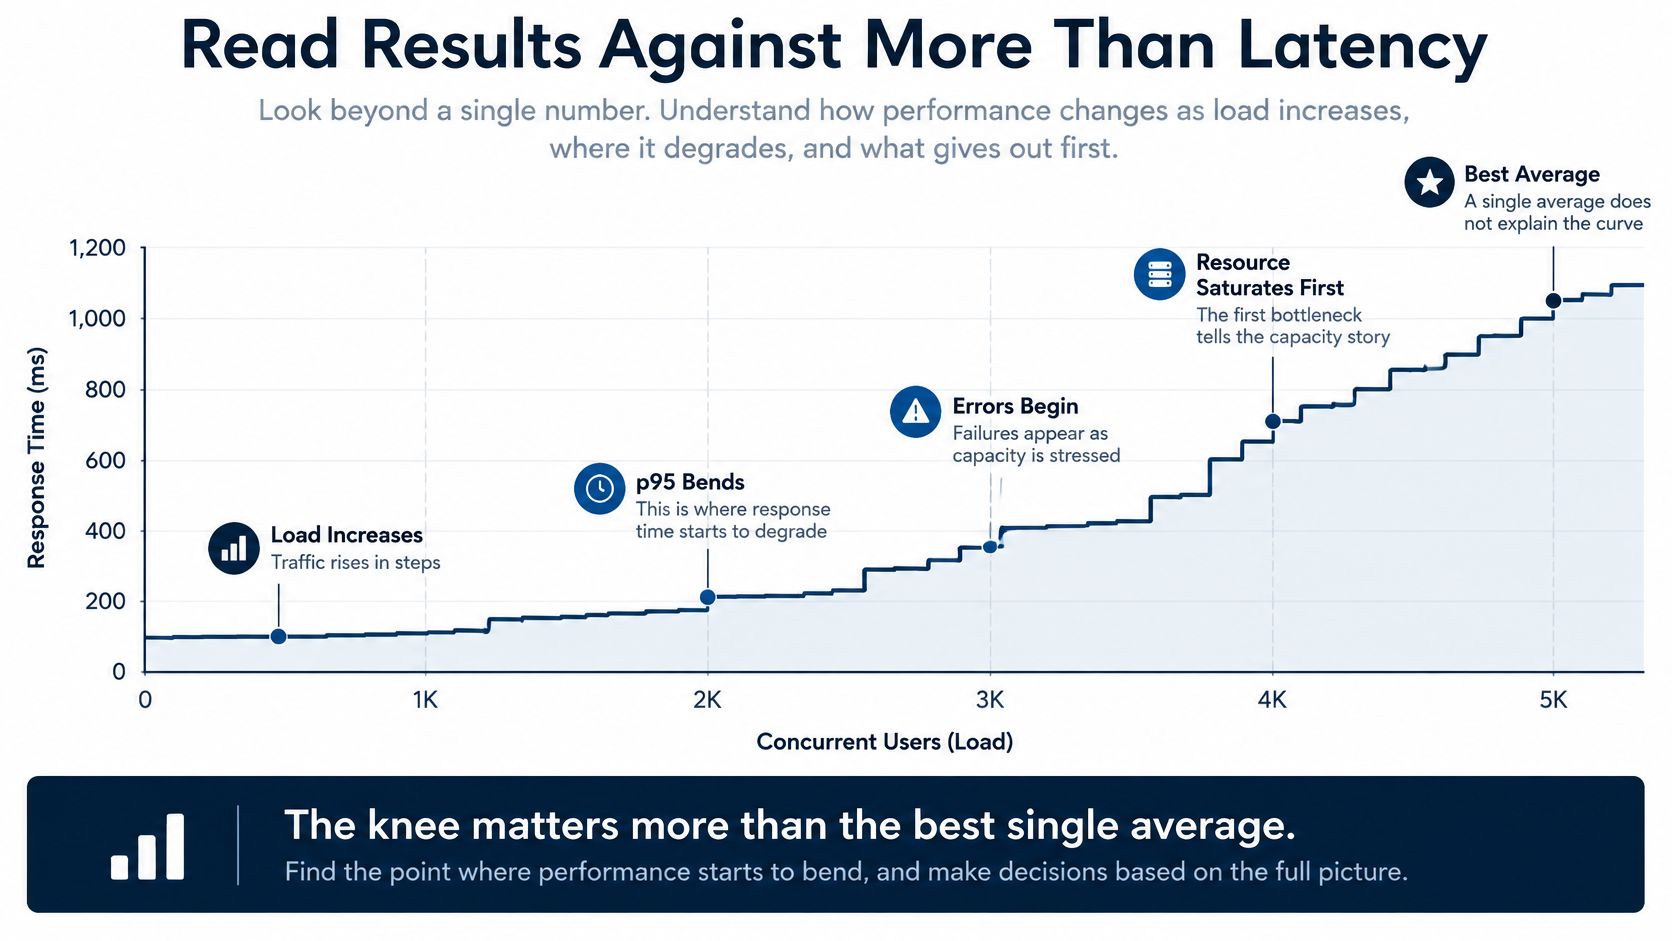
Read the run as a capacity curve. As load rises, inspect where p95 bends upward, where failures begin, and which resource saturates first. The highest successful throughput matters only alongside the experience and resource cost required to achieve it.
Separate populations before judging capacity
In a 2003 benchmark, IBM's benchmark report describes 1,380 concurrent interactive users, a maximum interactive response time of 0.08 seconds, and more than 14,000 single batch claims processed within a one-hour window. Those are separate achievements, not interchangeable measures of success.
The lesson isn't to adopt those historical response times. It's to judge interactive users and batch work against their own objectives so a strong result in one population can't conceal a weak result elsewhere.
When completed throughput stops rising, correlate it with waiting time and resource use. Fivenines' guide can help teams diagnose bottlenecks with throughput metrics, while AskYourQA's guide to bottleneck analysis in performance testing supports investigation across application and infrastructure layers.
Apply the full journey budget
A faster design can still be the wrong release if it needs expensive autoscaling or more model usage without improving the customer outcome. Gartner's software-engineering trends announcement identifies green software engineering as a priority, making resource efficiency relevant alongside speed.
Record each critical journey on its own acceptance line:
| Budget dimension | What the release team compares |
|---|---|
| p95 latency | Observed journey p95 against its approved ceiling |
| Error rate | Failed business attempts against the permitted share |
| Throughput | Successful completions against forecast demand |
| Cost per transaction | Attributable operating cost divided by successful completions |
| Tokens per request | Input and output usage, including retries, against the AI budget |
| Energy or carbon | Measured or estimated impact, with boundaries and limitations |
For AI journeys, hold output-quality checks constant when comparing model sizes. A cheaper response isn't a valid improvement if it fails the task.
Compare regions, scaling policies, and storage placements under equivalent work. If energy measurement isn't available, disclose that gap rather than treating compute spend as a carbon measurement. The release team can then make an explicit trade-off instead of accepting speed at any price.
Decide What Ships After the Numbers
The release decision has distinct outcomes: ship, fix and retest, or revisit the architecture. Choose the outcome from the agreed budgets, not from how much effort the team has already spent preparing the release.
Match the action to the evidence
- Ship: Critical journeys meet their latency, error, throughput, and applicable cost budgets across repeated production-like runs. Forecast peak doesn't already exhaust the resource needed to absorb normal variation.
- Fix and retest: A query, pool limit, dependency timeout, or retry storm explains the miss. Assign an owner, change the suspected cause, and verify it against the same workload.
- Revisit architecture: Added capacity doesn't improve completed throughput, cost per transaction exceeds the product budget, or an AI path achieves speed only through unacceptable compute use.
A test that didn't reproduce its planned conditions needs another run, not an optimistic release label. Keep invalid evidence separate from a genuine product failure.
Record a decision someone can audit
Save the decision with the build identifier, conditions, budget values, exceptions, and approving owner. If the team accepts a risk, record its scope and mitigation rather than relaxing the threshold.
At AskYourQA, we start by mapping the journeys the client's business depends on, not just the flows that are easy to automate. For Up Romania, we delivered backend and mobile test automation and performance testing, and integrated automated testing into the development workflow.
The smallest useful next action is to name a critical journey, complete its exit rules, and schedule a comparable run before the release deadline. If your team can't build the framework and pipeline integration alongside product delivery, specialist support is an option, not a prerequisite for starting.
Wire Performance Gates Into CI/CD
Make the gate routine by matching the test depth to the delivery stage. A pull-request check should provide quick regression feedback; it shouldn't claim the same confidence as a full capacity exercise.
Match execution to release risk
- Pull requests: Run a short performance smoke on selected critical journeys at low concurrency. Apply journey limits and a pre-agreed regression margin against the stored baseline, with enough samples to make the comparison meaningful.
- Main-branch or nightly builds: Run repeated load steps or a soak suited to detecting drift, leaks, and background-work interference.
- Release candidates: Execute forecast-peak load, spike, and production-volume scenarios, plus other tests required by the change. Evaluate each journey separately.
AskYourQA's guide to CI/CD integration testing provides context for fitting automated checks into delivery workflows. Performance jobs also need controlled runner capacity and generators outside the application environment.
Keep the gate trustworthy
Store raw results with the build, environment version, dependency versions, and workload definition. Reject shared-staging results when unrelated traffic makes them incomparable, and send valid failures to the named owner rather than a generic queue.
Availability monitoring has a different job. SiteAlive's resource on understanding uptime checks helps distinguish ongoing reachability checks from tests that establish whether critical journeys remain usable under load.
Block promotion only on agreed budgets. Review those budgets quarterly against production telemetry, and version any changes so teams can't move the pass line during a failing release.
AskYourQA designs test automation systems that connect business-critical journeys, performance testing, and CI/CD feedback. Visit AskYourQA to book a free 20-minute call where we map your critical flows and show how fast the automation framework can be up and running.