
It's 9:40 on a Monday morning and your support channel is full of the same message. The checkout page is spinning. Nothing in the release notes changed, but a partner newsletter went out at nine and the traffic graph is now a vertical line. Yesterday the app was comfortable at 400 concurrent shoppers. Today it times out at 1,100, and nobody on the team can say whether a second server would fix it or change nothing at all.
The usual response is to add capacity and hope, or to run one enormous load test the week before launch and treat the biggest number it produces as the answer. Neither tells you where the limit is or what causes it.
Scalability testing in software testing answers that question with evidence. It works best as a series of small, controlled experiments that show how performance reacts when you add both demand and resources at the same time. Run it that way and you learn where your capacity stops growing, which is the only number that helps you plan a launch.
Table of Contents
- What Scalability Testing Measures
- Scalability, Load and Stress Testing Compared
- Key Metrics and the Targets to Set
- How to Run a Scalability Test Step by Step
- Finding Bottlenecks Before Users Do
- Scaling a Checkout Service in Practice
- Plan Your First Scalability Test Run
What Scalability Testing Measures
Picture a high street shop on an ordinary Tuesday. Two staff, a short queue, everything calm. Now picture the same shop on the first day of a sale, when forty people arrive at once and the tills seize up. The shop didn't get worse overnight. It met a limit nobody had measured.
Scalability testing measures how a system's speed, stability and throughput change as load and capacity both increase, so you can tell whether adding servers, nodes or database capacity actually buys useful headroom.
A restaurant makes the idea concrete. A kitchen that serves 50 covers an evening should serve roughly 100 once you add a second oven and a second chef. Scalability testing is how you find out whether it really does, or whether both chefs end up waiting on the same single sink.
That's why the output is a curve, not a number. One peak figure tells you a system survived a Tuesday. The curve tells you the shape of the next twelve months. Performance testing as a whole measures speed, stability and scalability under real-world load, and scalability is the part that asks how capacity grows.

So the question worth answering for your own product is narrow and specific. When demand doubles and you double the servers, what happens to response times, error rates and throughput? If you can't answer that with a chart, you don't have a capacity plan yet.
Scalability, Load and Stress Testing Compared
The difference fits in one sentence. Load testing checks that targets hold at expected traffic, stress testing finds the breaking point, and scalability testing measures how much capacity each added resource delivers. All three use the same tools and often the same scripts, so the distinction is the question you ask and the load pattern you choose.
| Test type | Core question | Load pattern | Main result |
|---|---|---|---|
| Load testing | Does the system meet targets at expected traffic? | Expected peak held for a set time | Pass or fail against response-time and error targets |
| Stress testing | Where does the system break, and how does it recover? | Load pushed beyond planned capacity | Breaking point and recovery behaviour |
| Scalability testing | Does capacity grow when resources are added? | Stepped user increases, with resources added at each step | Throughput and latency for each resource level |
| Endurance (soak) testing | Does performance hold over many hours? | Expected load sustained for hours | Memory growth, drift and slow degradation |
Take a ticket-booking site that expects 2,000 concurrent buyers on its next on-sale. A load test holds 2,000 users for an hour and checks p95 latency and error rate. A stress test pushes to 6,000 to see whether the queue degrades gracefully or the database falls over. A scalability test steps from 2,000 to 8,000 in increments, adding an application server at each stage, and records how much throughput each server contributes. An endurance test sits at 2,000 users for 12 hours and watches for memory creeping upward.
Same product, four different questions. Load testing tells you whether you can launch on Friday. Scalability testing tells you what to do when marketing doubles the budget in March. If you want the mechanics of the first one, this guide to what a load test measures covers the setup in detail.
Rule of thumb: start with load testing for launch readiness, then add scalability testing the moment you have a growth target to hit.
Key Metrics and the Targets to Set
A single run produces hundreds of numbers. Four or five decide the outcome, and one of them carries most of the weight.
Throughput, measured in requests per second, shows how much work the system finishes as load grows. It should rise roughly in step with the resources you add, until the knee. If throughput flatlines while you keep adding servers, the extra capacity is being spent on contention rather than work.
Then comes p95 response time, the delay that 95 out of every 100 requests stay under. This is the metric that is often misunderstood, because averages look healthy long after real users are suffering. If 95 percent of requests take 200 ms and 5 percent take 4 seconds, your average is a comfortable 390 ms while one in twenty shoppers is staring at a spinner. Report percentiles, always, and treat p99 as the early warning of queue growth.
| Metric | What it reveals | Example target |
|---|---|---|
| Throughput (requests per second) | Work completed as load grows | Rises in line with added resources up to the knee |
| p95 response time | Delay felt by most users | Under 500 ms at expected peak |
| Error rate | Failures under load | Under 1 percent of requests |
| CPU and memory use | Headroom before saturation | CPU under 70 percent at expected peak, memory flat across the run |
| Connection pool or queue use | Early sign of a bottleneck | Under 80 percent of pool capacity in steady state |
| Scale-out time | How fast new capacity serves traffic | Under 3 minutes from trigger to healthy |
Error rate is the blunt one. A rise from 0.1 percent to 2 percent at a given user level means that level is already past your limit, whatever the latency chart says. CPU and memory show how much headroom remains before saturation, and memory that climbs steadily across a long run points to a leak rather than load. Connection pool and queue depth are the early-warning lights: a pool sitting at 100 of 100 connections while CPU idles at 40 percent tells you the database, not the application server, is the constraint.
Practical rule: write your targets down before the first run and agree them with product and operations. A test with no stated pass mark turns into an argument about interpretation.
How to Run a Scalability Test Step by Step
The discipline that separates a real scalability test from load generation is isolation. A 2022 peer-reviewed study in Empirical Software Engineering noted that cloud-native teams had no commonly accepted method for benchmarking scalability, and proposed one built on three elements: scalability metrics, measurement methods and a dedicated benchmarking architecture. Its core move is to evaluate isolated combinations of workload and resource levels, then check whether the defined service-level objectives still hold. That's the difference between pushing a big request volume and producing evidence about capacity.
Here's the sequence, with the reason for each step.
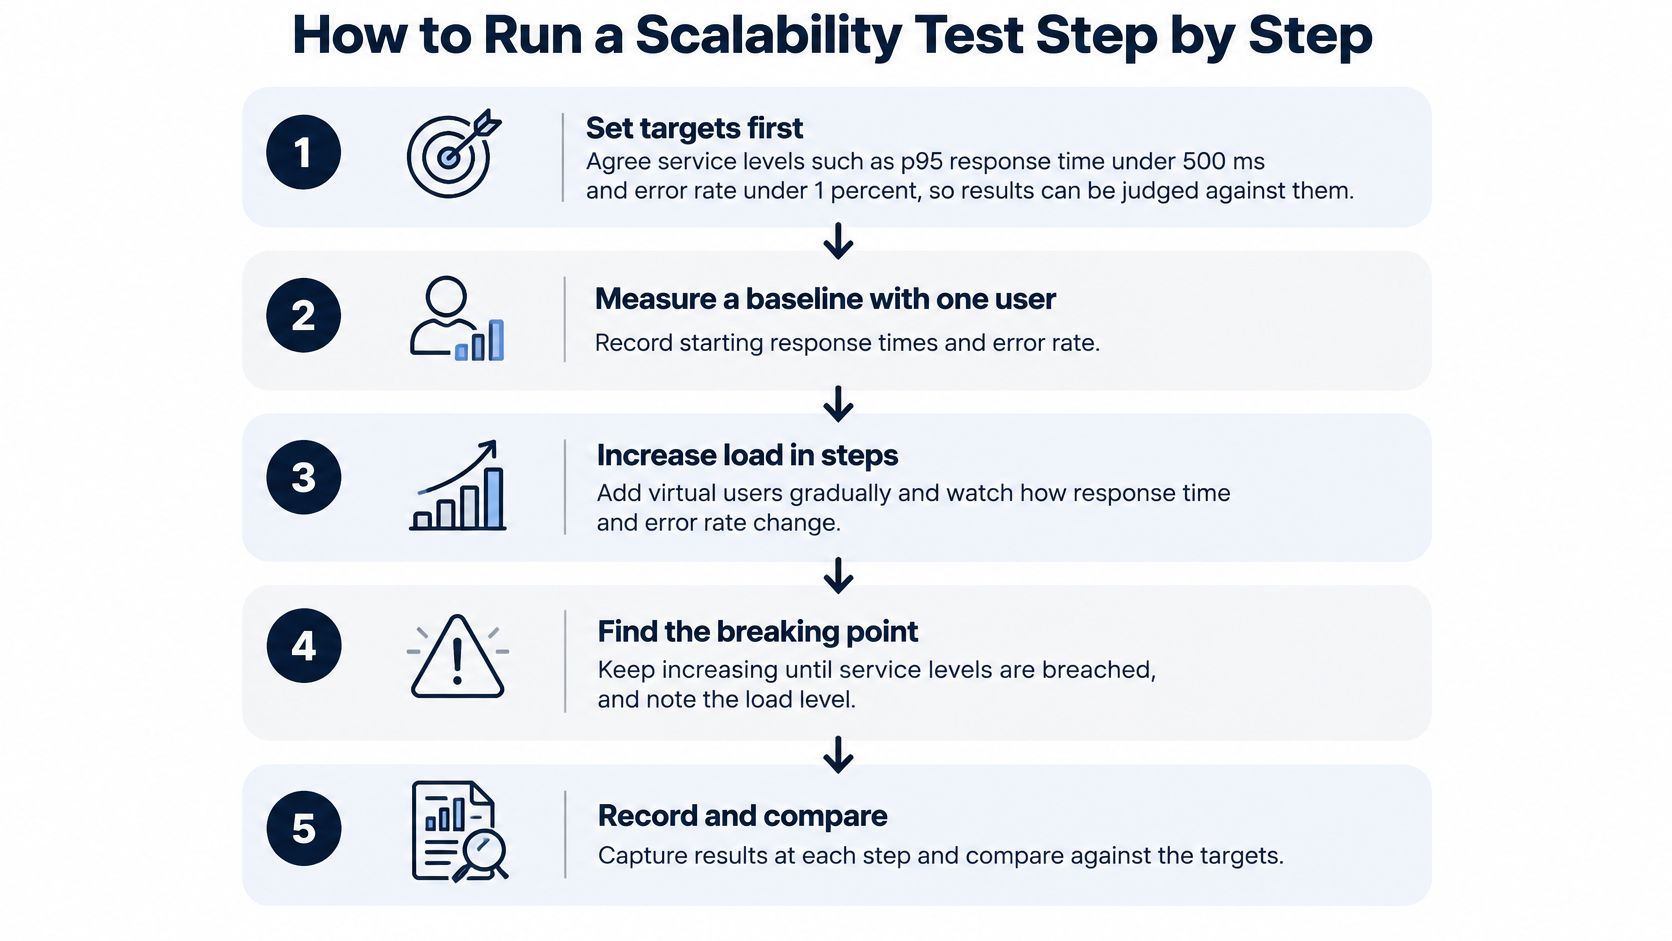
- Set targets first. Agree service levels such as p95 under 500 ms and error rate under 1 percent. Without a written pass mark, every result becomes a debate, and the loudest person in the room settles it.
- Measure a baseline with one resource unit. Run a low, steady load against one server and record latency, errors, CPU and memory. This is your reference; skip it and you can't tell whether a later change helped or hurt.
- Step users up in fixed increments. Go 500, 1,000, 1,500, 2,000, holding each step for 10 to 15 minutes so the system settles into a steady state. The common slip here is refreshing the test data between steps, which makes two runs impossible to compare.
- Add one resource unit and repeat the same steps. Record the throughput gain per server. If two servers deliver 1.8 times the throughput of one you're close to linear; if they deliver 1.3 times, something shared is throttling you.
- Continue past expected peak into overload. Watch where errors begin and whether the system recovers when load drops away. A system that fails cleanly and comes back is far easier to operate than one that half-fails for an hour.
- Plot throughput and latency against resource count and mark the knee. The knee is where an extra server stops buying useful capacity. That point, not the peak user count, belongs in your capacity plan.
- Repeat each run at least three times. Compare against the previous build before calling anything a regression, because a single run in a shared cloud is weak evidence either way.
You've run it correctly when throughput rises roughly in line with added resources up to the knee, and every target holds at expected peak. Here's a walkthrough of the thinking behind the numbers.
Finding Bottlenecks Before Users Do
A bottleneck is the first resource that stops the throughput curve climbing, and it's rarely where the team expects. The good news is that each symptom points at a short list of suspects.
| Symptom | Likely bottleneck | Where to look first |
|---|---|---|
| Throughput flattens while CPU stays low | Locks, connection pool or slow downstream API | Pool size, thread waits and dependency latency |
| CPU pegged while throughput still rises | Compute-bound service | Profiles of the hottest code paths, then scale out |
| Latency jumps at one user level | Slow queries, missing index or lock contention | Slow query log and database lock waits |
| Errors rise only after scale-out | Shared cache, session stickiness or load-balancer limit | Balancer configuration and cache hit rate |
| Results differ between identical runs | Noisy environment or shared cloud capacity | Run-to-run spread and environment logs |
Start with the flat throughput line and low CPU, because that combination misleads many engineers. It usually means locks, a saturated connection pool or a slow downstream API. Check pool size, thread waits and dependency latency before you touch application code.
When CPU is pinned and throughput keeps climbing, the service is compute-bound. Profile the hottest code paths, then decide whether to scale out or optimise. A latency jump at exactly one user level almost always points at the database, so open the slow query log and look at lock waits. Errors that appear only after new instances come online suggest a shared cache, session stickiness or a load-balancer limit.
One good run is not proof of anything. A 2025 longitudinal cloud-benchmarking study reported roughly 591 hours of experiments, 789 Kubernetes clusters deployed on Amazon Web Services and 2,366 benchmark executions, and found end-to-end performance variability with a coefficient of variation below 3.7%. Reusing the benchmarking infrastructure cut result accuracy by no more than 2.5 percentage points. The lesson is simple: repeat comparable workloads, quantify the spread, and store environment configuration, execution timing and repetition counts next to every result.
Confirm a suspect by changing one thing at a time, rerunning three times, and checking which metric moved first.
If your team is also chasing front-end speed as a separate problem, this real-user speed guide for UK teams covers the browser side, which is where a surprising share of "server" complaints originate. For a deeper method on isolating the culprit, read this guide to bottleneck analysis in performance testing.
Scaling a Checkout Service in Practice
Numbers make the method real. Say an online store runs a checkout service on a single application server behind a load balancer, with a Postgres database on one instance. The team writes targets of p95 under 500 ms and error rate under 1 percent.
At baseline, one server handles 500 concurrent shoppers with p95 at 300 ms and no errors. At 1,000 users, still fine. At 1,200 users, p95 jumps to 2.4 seconds and errors appear. The obvious move is a second server.
That second server lifts throughput by only about 30 percent. Now the metrics earn their keep: CPU across both servers sits at 40 percent, while the database connection pool is pinned at 100 of 100 connections. The limit is shared, not compute. The team raises the pool, reruns the same steps three times with identical test data, and the knee moves to roughly 1,700 users. The next wall shows up in a call to the payment provider, which they fix with a sane timeout and a queue in front of it.
Each fix moved the knee, and each was proven by a rerun rather than a hunch. That pattern repeats: fix the first bottleneck, and the next one appears at a higher load, usually somewhere you weren't looking. The same sequencing applies to API layers, which is why performance testing for APIs deserves its own attention. When AskYourQA worked with SenturoPay, a mobile banking app for cryptocurrency payments, it developed automated testing frameworks for backend and mobile platforms and ran performance testing to validate scalability and reliability.
What a smaller environment can and can't tell you
Testing at a fraction of production scale is common, and that's fine if you're careful. Research on scaled distributed-system testing asks directly whether a service on fewer machines can match the full-scale baseline, and notes that large realistic environments are expensive and hard to reproduce.
The dividing line is invariance. Keep the request mix, inter-arrival distribution, payload size, dependency latency, cache state and concurrency the same, because those drive the result. CPU topology, network paths, storage I/O and autoscaling behaviour can differ, but then you can only extrapolate findings that the workload itself produced.
Capacity limits show up first in tail latency, queue growth, throttling and error rates, so read those before you look at average throughput.
Plan Your First Scalability Test Run
Start with the decision that matters most: list the user journeys your business depends on, not the flows that are easiest to script. Login, search, checkout and payment callbacks carry the revenue; an unused settings page doesn't.
Then take three actions this sprint.
- Write your targets. Pull them from the metrics table, then agree them with product and operations so nobody renegotiates after the results land.
- Run a baseline and one stepped test against a production-like environment, and plot the curve.
- Set the cadence. A fast representative check on every pull request, scheduled endurance and capacity runs each release, and targeted scenarios whenever architecture, database access, concurrency or autoscaling changes. A cloud distributed-system study makes the case for repeatable long-running tests built on production request logs and statistical inter-arrival distributions, since synthetic uniform traffic misses how real users arrive.
A smaller, realistic run often gives better decisions than a massive unrealistic one, and remember that the test system itself can become a bottleneck when its architecture doesn't scale with the thing it's testing.
AskYourQA offers a free 20-minute call that maps your critical flows and shows how fast a test framework can be up and running.
Which user journey would hurt most if it slowed at your next launch? That's the first one to test.
If you'd rather find your capacity limits before your users do, AskYourQA runs performance testing for load, stress and scalability and builds automation around the journeys your business depends on. We start by mapping your critical flows, then show you how quickly a framework can be running against them. Visit AskYourQA to book a free 20-minute call and bring your next launch date with you.