
Your checkout service passed every performance test the pipeline ran on Tuesday morning. Load test, stress test, the lot. By Thursday night it's timing out, and nobody has deployed since. Memory has been climbing the whole time, a little with each request, until the process ran out of room in the middle of peak traffic.
That failure is what soak testing exists to catch, and it is the one many groups never look for. This covers what it is, how long to run it, and how to read the results without talking yourself into a false all-clear.
Table of Contents
- What Soak Testing Is and Why It Matters
- How Soak Testing Differs From Load and Stress Tests
- How Long a Soak Test Should Run
- How to Set Up and Run a Soak Test
- Reading Soak Test Results Without Fooling Yourself
- Examples and Mistakes That Skew Soak Results
- Decide Whether Your Next Release Needs a Soak Test
What Soak Testing Is and Why It Matters
Soak testing holds a realistic, average-production workload against a system for an unusually long period, then judges the system on what changed while nobody was watching. The Grafana k6 testing documentation draws the line between a soak test and an average-load test almost entirely on duration: both use realistic traffic, but the soak keeps that traffic running for hours or days while you monitor degradation, resource consumption, availability and stability.
Think of a bathtub with the tap on a low trickle. A ten-minute check tells you water is running. Leaving it overnight tells you whether the tub eventually overflows.

The defects it hunts are slow by nature. Memory that never gets released. Connection pools that drain because one code path forgets to return its connection. Queues filling slightly faster than they're consumed. Logs and temp files eating disk. Response times drifting upward while throughput holds flat. None of that shows up in a fifteen-minute run, because none of it has had time to accumulate.
Peak-load testing answers a different question: how much traffic can this thing take at once. Soak testing asks whether it stays healthy while taking normal traffic for a long time.
Practical rule: if your service only survives because someone restarts it every night, you have a leak you haven't found yet. The restart is hiding it, not fixing it.
Two things must exist before the run starts. A workload profile that mirrors production, and written pass or fail criteria. Grafana's guide lists stable throughput, bounded p95 or p99 latency, no unbounded heap growth and no decline in successful transactions among the thresholds that turn a long run into a decision. Without them you produce a folder of charts and an argument.
How Soak Testing Differs From Load and Stress Tests
The four test types get mixed up constantly, so start with the comparison.
| Test type | Workload shape | Typical duration | Question it answers | Failures it tends to find |
|---|---|---|---|---|
| Load test | Expected peak traffic | Minutes to a few hours | Does the system handle expected peak? | Slow queries and capacity shortfalls |
| Stress test | Load pushed past limits | Short bursts until failure | Where does the system break? | Breaking points and failure behavior |
| Spike test | Sudden jump in traffic | Short bursts | Does the system survive a surge? | Autoscaling lag and queue overflow |
| Soak test | Steady, realistic average load | Several hours to several days | Does the system stay healthy over time? | Memory leaks, connection pool exhaustion, disk or log growth |
A load test proves you can serve the traffic you expect. A stress test finds the ceiling and shows how the system behaves on the way down. A spike test checks whether autoscaling and queues react fast enough to a surge. A soak test holds a steady, believable load and watches for decay.
Here's where teams get caught. A thirty-minute peak test can report 200 ms response times and look perfect. The same service, run for 24 hours, drifts to 900 ms because database connections are opened and never returned, so every request after hour six waits longer for a free one. Nothing crashed. Nothing errored. The system became slower at the same traffic, which is exactly the kind of failure a short test can't see.
A soak test is not a harder load test. It's a load test that stops hiding the clock.
Soak tests usually reuse your existing load-test scripts. What changes is the duration, the metrics you watch, and the question you're asking. The ramp up, steady hold and ramp down shape is standard, and the Dometrain performance testing workshop notes frame the result in reliability terms: the test provides evidence about sustained maturity and availability under expected operating conditions, which is the same ground ISO/IEC 25010 covers under reliability.
You'll also meet the label endurance testing, and sometimes longevity or stability testing. They describe the same technique. The label changes; the duration and the question don't.
Run soak first only if you enjoy wasting a day. The order is load test, then soak. A system that falls over at peak traffic won't teach you anything useful across 24 hours, and the fix for a capacity problem is different from the fix for a leak. If you're still building that baseline, this guide to how to plan DXP load tests covers workload modelling and scenario design. And if load testing itself is new ground, read what a load test actually measures before you extend a run past a few hours.
How Long a Soak Test Should Run
Duration isn't a scheduling preference. It's a property of the defect you suspect.
| Duration | What it can reveal | Good fit for |
|---|---|---|
| 3 to 4 hours | Obvious leaks and early drift | Routine release checks |
| 8 to 12 hours | One working day of session and cache behavior | Services with a daily usage cycle |
| 24 hours | Daily jobs, log rotation and garbage-collection patterns | Long-lived processes and scheduled jobs |
| 48 to 72 hours | Several daily cycles and slower leaks | Services with scheduled jobs and batch cycles |
| 1 week or more | Token or certificate expiry and slow fragmentation | Weekly batch work and slow memory leaks |
The range is wide. Microsoft's performance testing guidance) puts test duration anywhere from about 20 minutes to a week, and notes that constant-load runs may stretch a week or more when the target is a slow memory leak.
The two-cycle rule
Run at least two complete cycles of the slowest recurring event in production. That might be a nightly aggregation, a weekly cleanup, a cache TTL, a log rotation window or a month-end batch.
The AWS performance testing guide makes the operational point well: generic windows don't answer the question for systems with scheduled jobs, token expiry or weekly batch cycles. A 24-hour run covers daily behavior. It exercises a weekly aggregation exactly never. Worse, a nightly job run once gives you a single data point, so you can't tell a real leak from a one-off allocation spike.
Run to the cycle, not to the clock. If your slowest recurring event is a Sunday-night cleanup, a Wednesday soak never touches it.
Project the failure instead of guessing
If memory or connections grow at a steady rate, you don't need to wait for the crash. Measure the slope, divide the remaining headroom by it, and you have an estimated time to exhaustion. That number tells you whether your deploy cycle outruns the problem, and it lets you stop the test on evidence instead of midnight.
The warning that matters most: a long run on an unrealistic workload proves nothing at all. Seventy-two hours of traffic that doesn't resemble your users will happily report stability while the actual pattern breaks in production. Model the workload first. Then pick the duration.
How to Set Up and Run a Soak Test
Get the order right, because each step protects the next. Microsoft's Azure Well-Architected performance testing guidance is explicit that endurance testing belongs after baseline load tests pass, and that it needs a production-like environment with full resource allocation, since the defects you're hunting only surface during extended operation. That last part is the step teams skip most often.
This short walkthrough covers the mechanics of holding a steady load and watching what happens:
A small test box with 2 GB of RAM and a shared database will not leak the way a production node with 16 GB does. The allocation ceiling arrives at a different time, the pool sizes differ, and the garbage collector behaves differently. You end up testing the test environment.
Here's the full sequence:
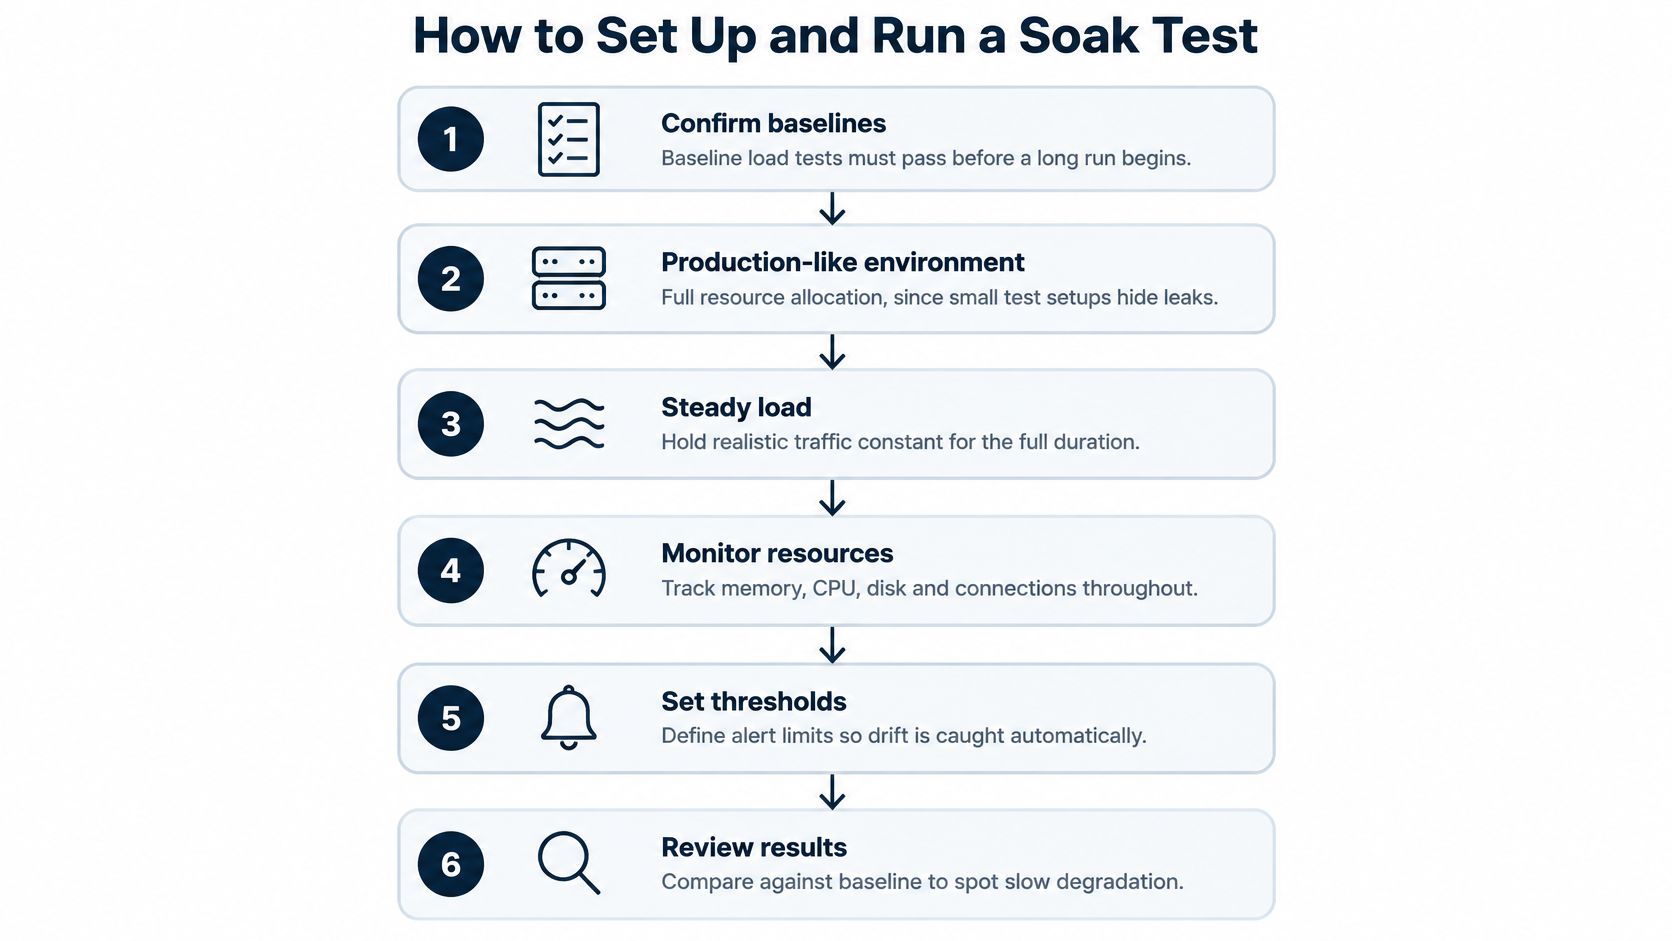
The steps, in order
- Confirm baseline load tests pass, because a system that can't handle peak will fail a long run for the wrong reason and teach you nothing.
- Build a production-like environment with full resource allocation, since undersized machines hide the leaks you're looking for.
- Model a realistic workload at roughly 70% of peak, with the actual request mix, think time, payload sizes, authentication renewal and background activity, because a synthetic single endpoint tests your script rather than your system.
- Write the acceptance thresholds before the run, covering stable throughput, a bounded error rate, no sustained rise in post-GC heap, no steady growth in connections or threads, and latency percentiles inside the agreed objective.
- Run the load generator in CLI mode with minimal listeners and incremental result writes, so the harness doesn't become the bottleneck and you don't spend night two debugging the tool.
- Sample the right metrics at fixed intervals, including request rate, p95 and p99 latency, error rate, heap, thread count, connection pool use, disk capacity, CPU and GC pauses.
- Ramp down and compare the first hour with the last, because the difference between them is the finding, and a system that recovers its baseline tells you something a system that doesn't, doesn't.
Reading Soak Test Results Without Fooling Yourself
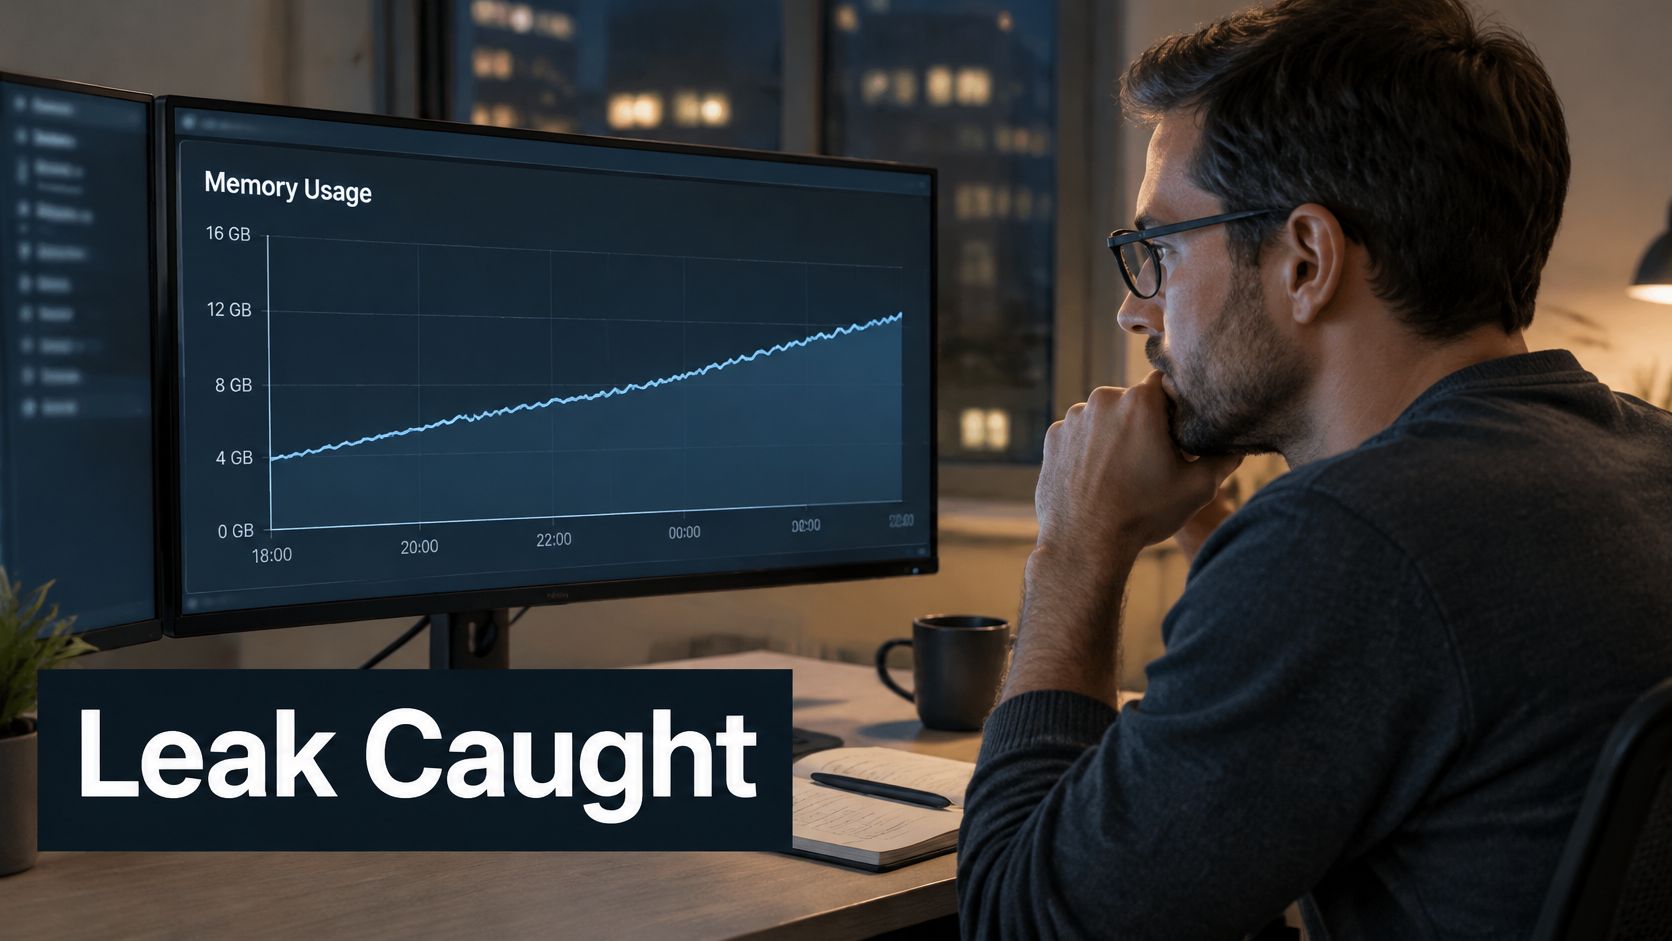
Start with the single most diagnostic line on the dashboard: the post-GC heap floor, the memory left after a full garbage collection. Healthy applications produce a sawtooth, rising as work allocates and falling back to roughly the same floor after each collection. A leak produces a sawtooth whose floor climbs, valley after valley, while throughput stays flat. That's the signature worth waking someone for.
Ignore the peaks. Peak height depends on allocation timing relative to the last collection, so peak-to-peak comparison manufactures false positives.
| Trend observed | What it usually means | Next check |
|---|---|---|
| Post-GC heap rises steadily under flat load | Memory leak | Heap snapshots at intervals and object counts over time |
| Connection count climbs and never falls | Connections not returned to the pool | Pool settings and connection close paths |
| p95 latency drifts up at the same throughput | Fragmentation or cleanup lag | GC pause times and queue depth |
| Errors jump at the same clock time each day | Token expiry or scheduled job | Failure timestamps against the job schedule |
| Disk usage grows in a straight line | Logs or temp files not rotated | Log rotation and cleanup job settings |
The fourth row is the one that confuses people. Errors clustered at 02:00 every night rarely mean the system is overloaded. They usually mean a scheduled job and a background worker are colliding, or a credential rotated at a fixed hour. The clock is the clue, and it only becomes visible in a run long enough to contain two of those events.
Correlate before you conclude
Pull application logs and infrastructure metrics onto the same timeline and find the hour degradation began. "Latency rose" is an observation. "Latency rose at hour nine, forty minutes after connection acquisition time started climbing" is a bug report. When throughput is fine but latency drifts, bottleneck analysis in performance testing is the next step rather than more load.
Then check the test itself before you believe any finding. Radview's guide to detecting memory leaks under sustained load makes the case that a longer test is not automatically better: a poorly modelled 72-hour run produces misleading evidence, while a shorter run with a measurable leak slope gives stronger release information. The fix is workload realism. Production-derived request mixes, tenant distributions, payload sizes, real token refresh behavior, downstream calls and representative data volume.
A flat line means nothing until you know the workload was real. Confidence comes from the model, not the runtime.
Examples and Mistakes That Skew Soak Results
Two worked examples show why the leak rate sets the minimum duration.
Say an order service leaks about 40 MB of heap per hour under steady load, and it has 720 MB of headroom before the process hits its limit. A 4-hour check grows roughly 160 MB and looks clean, maybe even within normal variance. The failure lands at about hour 18 (40 × 18 = 720), comfortably inside a 24-hour run. That's the difference between a ticket and an outage.
Now say a service runs a pool of 100 database connections and one connection per twenty minutes fails to return because a close call sits on a path nobody tested. That's three connections an hour. The pool runs dry after roughly 33 hours, which is why an overnight run reports health and the second day doesn't. Divide the headroom by the measured rate, then make sure your planned duration exceeds the result.
The mistakes that distort the picture are consistent across teams:
| Mistake | Effect on the result | Fix |
|---|---|---|
| Testing one endpoint instead of the user journey mix | Misses slow queries and cache effects | Script the three critical user journeys (see setup step 3) |
| No written pass or fail thresholds | Any curve looks acceptable | Set thresholds before the run (see setup step 4) |
| Smaller environment than production | Hides leaks tied to real resources | Match production resource allocation (see setup step 2) |
| GUI and many listeners on the load generator | The test measures the tool | Run in CLI mode with minimal listeners (see setup step 5) |
| No baseline to compare against | Trends have no reference point | Keep first-hour and prior-release baselines (see result trends) |
| Stopping at hour two because the graph looks flat | Misses slow leaks | Run to the slowest cycle or projected exhaustion (see duration rule) |
Decide Whether Your Next Release Needs a Soak Test
Yes if the service is long-lived, runs scheduled jobs, depends on tokens or certificates that expire, or has passed load tests but has never run more than a few hours in production-like conditions. No if it's a short-lived stateless function where a few hours of peak load already covers the risk, because you'd be paying for runtime and learning nothing.
When the answer is yes, three steps get you moving:
- List the three business-critical user journeys the soak will exercise, not the endpoints that are easiest to script.
- Define the steady-state workload and the thresholds, usually around 70% of peak unless your own traffic data says otherwise, and write down what failure looks like before the run starts.
- Choose the duration from the slowest recurring production cycle, using the duration table earlier in this guide, then check the plan against your release go/no-go criteria for gyms and other high-traffic services so the result feeds a decision rather than a status update.
If you'd rather not build the harness in-house, our performance testing measures speed, stability and scalability under real-world load, and the same reliability test system thinking applies to soak runs. On a discovery call we map your current testing process and show where automation fits.
Either way, the next step is the same. Write the three thresholds before anyone starts a run.
A soak test only pays off when someone reads the slope and acts on it, and that's the part many teams never get to. AskYourQA builds performance and reliability testing into your delivery pipeline, including sustained-load soak runs that watch memory, connections and latency drift rather than a single green tick at the end. We start by mapping the critical user journeys your business depends on, then build the framework around them. Book a free 20-minute call with AskYourQA and we'll show you how fast that framework can be running.