
A widely cited NIST study estimated that inadequate software testing infrastructure cost the U.S. economy about $59.5 billion a year, and that better infrastructure could have produced about $22.2 billion in annual benefits. The same estimate found that more than half of software defects showed up downstream, when fixes are more expensive, and that finding and correcting defects accounted for about 80% of development cost. Treat those figures as historical U.S. benchmarks, not a current global total. They still change the job. A reliability test system is not a larger pile of scripts. It is a set of journey targets, a failure budget, and a health record for the environment that runs the tests.
Teams stall when a red build might be a broken checkout or a tired runner. Before anyone hits rerun, tag the failed run as a product defect, a test-infrastructure defect, or unknown. That label decides whether the journey failed, whether the lab failed, or whether you do not know yet.
Table of Contents
- Set Reliability Targets Before You Write a Test
- Reliability Test Types and When Each One Runs
- Design the Architecture and Choose Your Tools
- Wire Reliability Tests into Your CI/CD Pipeline
- Metrics, Alerts and Flaky Test Triage
- Confirm the First Reliability Gate Before Your Next Release
Set Reliability Targets Before You Write a Test
Start with the business question, not the tool. Which user journeys must keep working, and how much failure can each one tolerate? We map the journeys the business depends on, not only the flows that are easy to script.
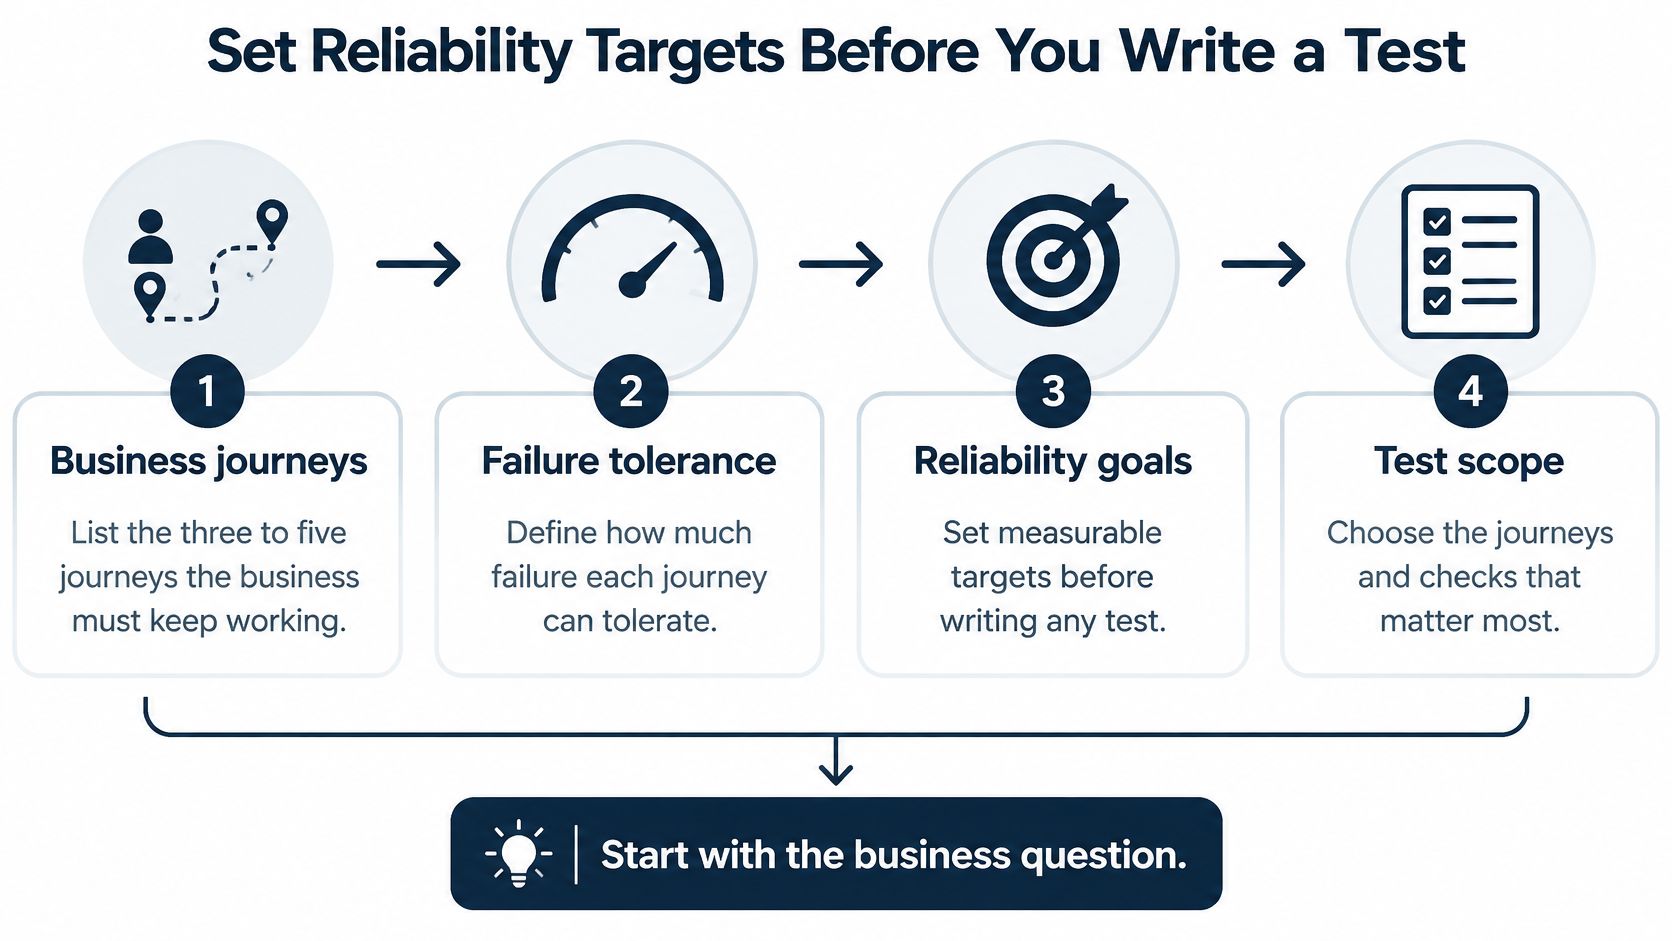
1. List three to five journeys. Rank them by revenue, support cost, and production traffic. For a payments product that is usually sign-up, checkout, payout, and the main API call. A rarely opened settings page does not belong on this list yet.
2. Set an availability target for each journey. Use the table as the reference, then adjust for how painful a miss is. Checkout that takes card payments should sit tighter than an internal admin screen.
| Availability target | Downtime per 30-day month | Typical use |
|---|---|---|
| 99% | 7 hours 12 minutes | Internal tools and back-office screens |
| 99.5% | 3 hours 36 minutes | Non-critical customer features |
3. Turn the target into a failure budget. Say checkout is held to 99.9% over a 30-day month. That leaves about 43 minutes of downtime to spend. Every incident, bad deploy, and dependency blip draws from those minutes. When the budget is gone, you stop shipping risk and you fix.
4. Write pass criteria the test can score. Availability alone is too coarse. For checkout, a useful bar is a successful payment, a response under 500 ms for 95% of requests, and no rise in payment errors at the expected peak. Those numbers become the pass line for later load runs.
5. Name an owner and a stop rule. One person owns each target. Agree in advance what happens when the budget runs out: freeze the release, page the owner, or both. A target with no owner is a poster.
Practical rule: A rarely used admin screen should not share checkout's budget. Same numbers on every page hide the journeys that actually lose money.
Risk-based software testing is the right companion habit here. You spend test time where a failure hurts, instead of spreading it evenly. The targets you just wrote are the expected-peak volume and the pass criteria the next set of tests has to check.
Reliability Test Types and When Each One Runs
A reliability test system holds six kinds of evidence. None of them replaces the others. Match the type to the risk before you add another suite.
| Test type | Question it answers | When to run | Starting example |
|---|---|---|---|
| Smoke | Does the core flow work at all? | Every commit | 5 to 10 critical journeys in under 10 minutes |
| Load | Does it hold expected peak traffic? | Nightly and before major releases | Expected peak plus about 20% for 30 to 60 minutes |
| Stress | Where does it break, and does it recover? | Weekly or before capacity changes | Ramp past peak until error rate rises, then ramp down |
| Soak | Does it leak memory or degrade over hours? | Weekly | Expected load held for 8 to 24 hours |
| Spike | Does it survive sudden bursts? | Before launches and promotions | Jump from baseline to 5 to 10 times normal in under a minute |
| Chaos | Does it stay up when a dependency fails? | Weekly in staging | Kill one service instance or add 500 ms latency to one dependency |
Smoke answers whether the build is even worth a longer run. It will not show a slow leak or a missing fallback. Keep it short so a broken commit fails in minutes, not after a nightly queue.
Load checks the volume you expect, plus a small margin. It will not show the cliff past that volume. If the script never walks a real payment path, a green load chart only proves the generator can send traffic.
Stress pushes until errors climb, then eases off so you can see recovery. It will not tell you whether Tuesday's normal peak is fine. Use it before you change instance size or connection pools, not as a daily ritual.
Soak is the long sit. Memory growth and creeping latency show up here and almost nowhere else. It will not catch a one-second burst. A nightly 15-minute run is not a soak.
Spike matters before a launch or a promotion, when traffic can jump in under a minute. It will not prove the system is stable for hours afterward. Pair it with the same journey you already smoke-tested.
Chaos removes one dependency or adds latency, then checks for a graceful fallback. It will not find a logic bug in the happy path. Run it in staging, on one dependency at a time, with a way to stop the experiment.
A NASA analysis of 55 high-impact software failures from 1962 to 2023 found that 40% of the software errors were tied to absent code: missing requirements, missing capabilities, or no handling for a situation nobody anticipated. Only 18% of incidents were blamed on the software discipline itself, and none on the choice of platform or toolset. Load alone will not catch a missing error path. Pair each type with at least one scenario written from a real user journey, including an unexpected state.
Start with smoke and load. Add stress, soak, spike, and chaos only after those two stay stable for a few releases.
Design the Architecture and Choose Your Tools

Four layers should share one configuration. Separate scripts for smoke, load, and chaos drift apart within a quarter, and then a "pass" means something different in each job.
Four layers, one config
Test definitions hold the journeys, the input classes, and the pass criteria. Weight each journey's run volume by how often it happens in production. Reliability is the chance of correct behavior on the traffic you receive, not the share of scripts that happen to be green. Deliberately oversample rare paths that would be severe if they failed, such as a refund after a partial charge.
The generator produces load and, when you are ready, faults. k6, JMeter, or Locust cover most HTTP and scripted load. Chaos Toolkit is a reasonable starting point for fault injection. Code-based tools stay easier to review in git. GUI tools are faster for a team that will not maintain scripts. Pick one style and stick to it.
Environments and data have to look like production in configuration, service versions, and data volume. A staging database that slowly diverges from production makes every chart lie. Refresh data on a schedule, and record the versions under test with the result.
Reporting should land in the dashboards you already read. A private HTML report that nobody opens is not a reliability test system.
Score a tool before you adopt it
- Protocol support: REST, gRPC, GraphQL, or WebSocket, matching the journeys in scope.
- Distributed load: generation from more than one machine, so one laptop is not the bottleneck.
- Fault injection: latency or instance loss without a custom harness for every service.
- Metric export: a format your existing dashboards already ingest.
Staging that does not match production configuration, versions, and data volume will not transfer. Fix the match before you argue about the tool.
Five questions have to have answers before anyone writes a test. Which journeys are in scope? Which protocol does each one use? Where does test data come from, and how is it refreshed? How are faults injected without touching production customers? Where are results stored, and who can see them?
Wire Reliability Tests into Your CI/CD Pipeline
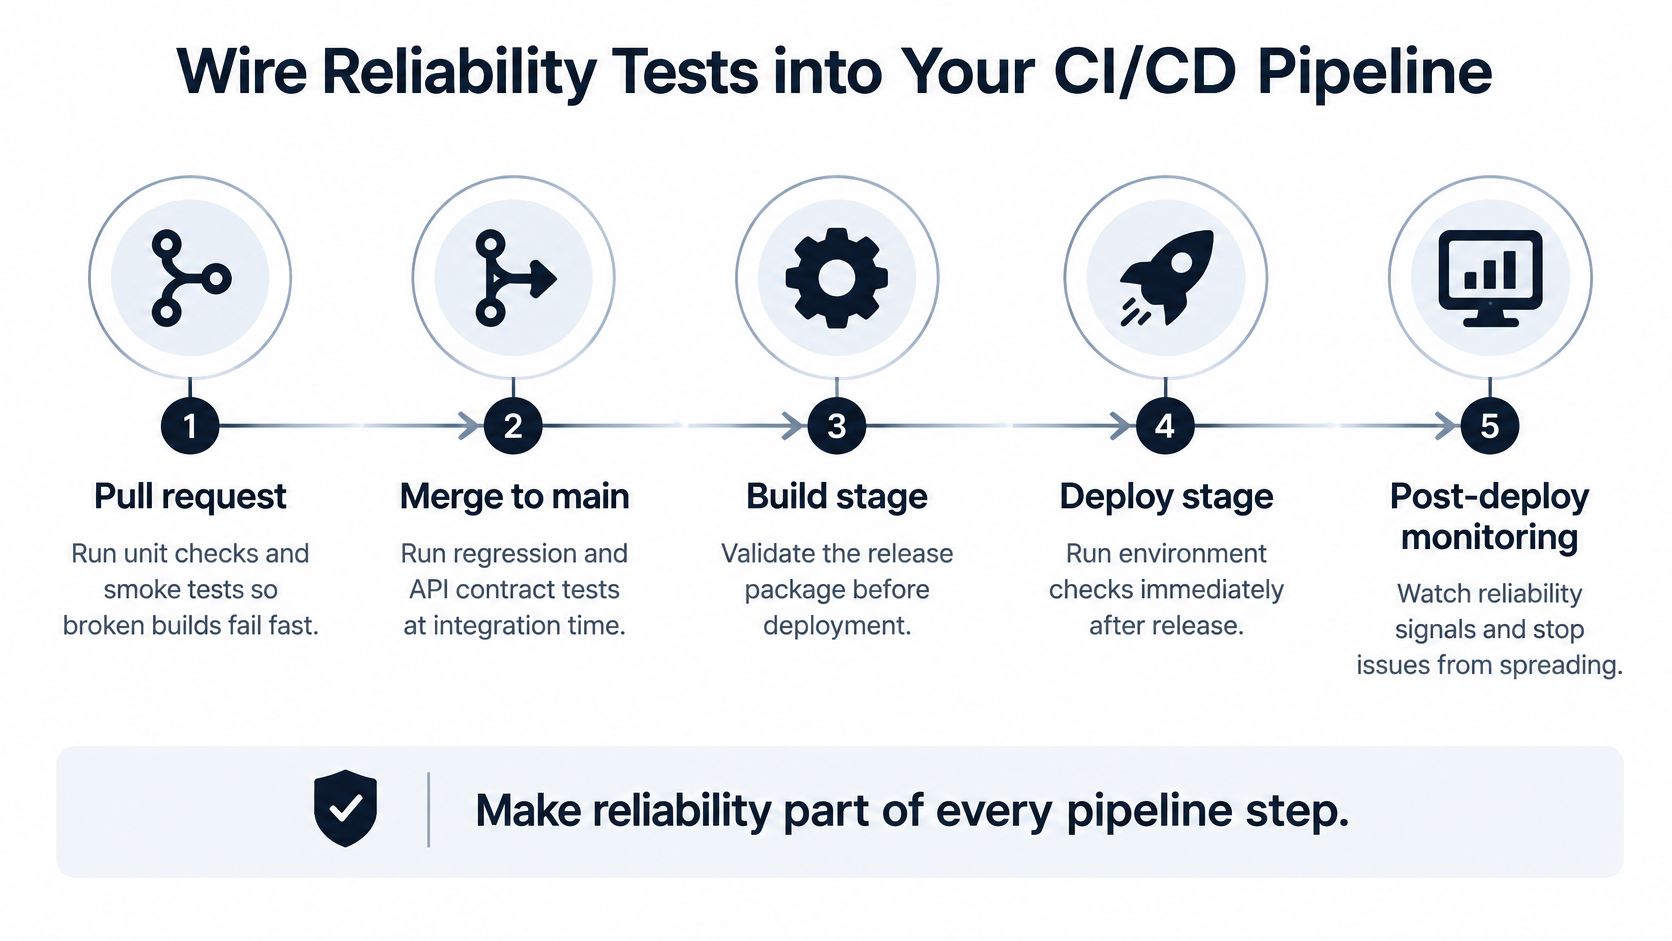
Put each test type on the pipeline point where its feedback is still cheap. A smoke failure in minutes is a small revert. A soak failure found a week later is a release argument.
Pull request. Run unit checks and the smoke set so a broken core flow never merges. Keep this under about 10 minutes or people will skip it.
Merge to main. Run regression and API contract tests against the integrated services. When a change in one service breaks a neighbor, CI/CD integration testing is the place to decide which contracts are blocking and which are informational.
Nightly. Run load, and soak when the environment can hold it, on a stable stack. Compare tonight's error rate and latency with last night's, not with an ideal from a slide.
Before release. Run spike, stress, and one targeted chaos scenario in staging. Gate the release on the journey pass criteria you already wrote.
Production. Run synthetic checks on the same critical journeys, plus only small fault injections that an owner has approved. Anything wider belongs in staging.
If your runners already live in GitHub Actions, it is worth knowing how to run GitHub Actions in the cloud when local agents run out of CPU during a load window. The point is a stable substrate, not a new place to hide flakes.
The pipeline above only helps if the lab itself is trustworthy. Research on OpenStack found that 55% of interconnected projects were hit by cross-project test instability, covering 1,535 tests and a cumulative 1,156 developer-days, and that about 70% of the affected tests were unit tests, according to Kyushu University's summary of that work. Causes included CI timing, temporary infrastructure failures, resource availability, dependency mismatches, and inconsistent configuration.
Record every failure with its runner, environment, and dependency versions before anyone reruns it. Then separate product defects from infrastructure defects. A rerun with no record hides the cause. A test can be calm alone and unreliable when it shares a runner with three other projects.
The short walkthrough below shows how a pipeline view of reliability tests looks when the stages stay in order.
Metrics, Alerts and Flaky Test Triage
Count what the budget cares about. A wall of green checks can still burn the 43 minutes you set aside for checkout.
| Metric | How to calculate | Alert when |
|---|---|---|
| Journey pass rate | Passed critical journey runs divided by total runs | Below target for two consecutive runs |
| Flake rate | Test runs that both passed and failed on identical code, divided by total runs | Test flakes in 3 of its last 10 runs |
| MTBF | Total exposure time divided by observed failures | Reported with a confidence interval, never as a bare number |
| MTTR | Average time from failure detection to recovery | Rising trend across two consecutive months |
| Error budget burn rate | Budget consumed per hour divided by the planned hourly rate | Above 2 times planned over one hour |
Journey pass rate is the share of critical runs that met the pass criteria. One miss is a ticket. Two runs in a row under target is a page.
Flake rate counts runs that both passed and failed on the same code. Three flakes in the last ten runs means the test is no longer evidence.
MTBF is exposure time divided by failures. Never publish it as a single number.
MTTR is the average time from detection to recovery. Watch the trend across two months, not a single heroic incident.
Burn rate compares budget used per hour with the planned hourly rate. Above 2 times planned for one hour is worth a page. One failed run is not.
Tag every failed run as a product defect, a test-infrastructure defect, or unknown before it counts toward pass rate or flake rate. Unknown stays out of both rates until someone classifies it. Otherwise environment noise inflates product failure, or a quiet retry hides a real regression.
The NIST engineering statistics handbook notes that confidence-interval precision generally improves with the square root of the number of failures observed. A 1,000-unit or very long test with only two failures can tell you less than a shorter test with five. State the target failure rate or MTBF and the confidence level first. Decide how many failures are allowed before the run starts. Record every failure with exposure time and conditions. Report the point estimate with an interval.
What distorts the number
- Early stop: ending after an arbitrary streak of passes.
- Retry inflation: counting a retry as a fresh independent success.
- Dropped intermittents: throwing away failures that did not repeat.
- Bare MTBF: quoting a mean with no uncertainty.
Each flaky test gets an owner, a deadline, and a quarantine label. Review the list every sprint. Quarantine keeps the signal clean. It is not a place to forget the test. A short BUNCH root cause analysis overview is a useful shared language when the owner has to say whether the cause sits in the product or in the runner. Pair that habit with a small set of quality software metrics so the dashboard stays tied to release risk, not to test count.
Confirm the First Reliability Gate Before Your Next Release
Pick one journey today. Checkout, sign-up, or the main API call is enough. Build smoke and load for that journey only, and run them on the release candidate.
The gate is simple. The release proceeds only if that journey meets its pass criteria and the burn rate stays under the alert line. Anything else waits.
Book the review for two weeks out, ideally the next sprint planning. Check four things only.
- Product defects: how many failed runs were the product.
- Infrastructure defects: how many were the runner, the data, or the config.
- Flakes: how many tests both passed and failed on the same code.
- Owners: whether each flaky test has a name and a deadline.
CI/CD integration puts that gate in the delivery pipeline so every release gets fast, reliable feedback instead of a late manual pass. After the first gate holds for three releases, add spike and soak, then extend the journey list. Do not widen the suite while the first gate is still noisy.
AskYourQA offers a free 20-minute call that maps your critical flows and shows how fast an automation framework can be up and running. Book a working session with AskYourQA to map your critical flows and set up the first gate.
AskYourQA designs the reliability test system around the journeys your business depends on, then wires smoke, load, and release gates into the pipeline so each build carries a clear pass or fail. On a short working session we map those flows with you and show how the first gate can run before the next release. Visit AskYourQA and book the free 20-minute call.