
Your release passed functional tests. The load test looked clean. Then production traffic shifted, writes replaced cheap reads, a downstream service slowed, queues grew, retries multiplied, and checkout timed out while dashboards still showed acceptable averages.
That's the gap software stress testing closes. Don't treat it as a bigger load test. Treat it as a controlled capacity and recovery experiment that tells you where the system breaks, what saturates first, how it fails, and whether it recovers without manual intervention.
Table of Contents
- Why Software Stress Testing Matters Before Release
- Designing Stress Tests You Can Trust
- Building Realistic Stress Scenarios Step by Step
- Tools and Environments Worth Considering
- Interpreting Results and Spotting Real Bottlenecks
- Common Failure Modes Stress Tests Expose
- Integrating Stress Tests into the Release Workflow
- Recommendations for Building a Stress Testing Practice
Why Software Stress Testing Matters Before Release
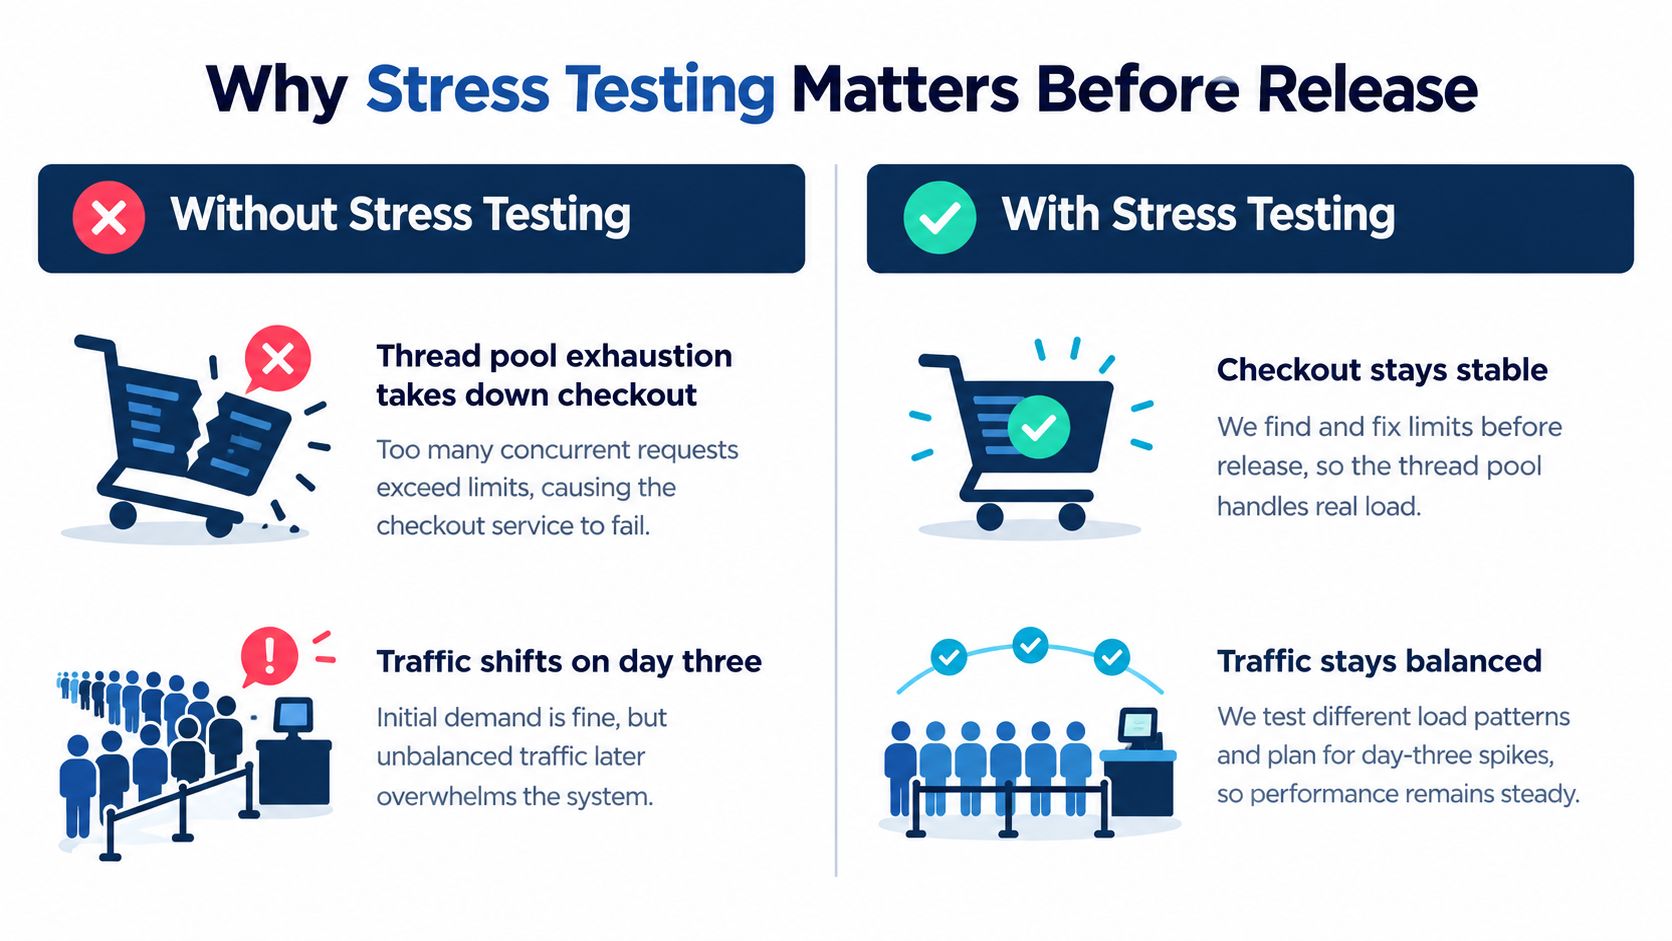
Day three after release is the pattern senior engineers recognize. Traffic composition changes, a queue backs up, thread pool exhaustion spreads from one service to checkout, and users discover a limit your test suite never approached.
Functional tests can't catch that. They prove a journey works, not that it survives contention, slow dependencies, connection pool exhaustion, or sustained allocation pressure. A green build tells you almost nothing about failure behavior.
Three Tests, Three Different Questions
A 2002 TestWorks review drawing on the IEEE Standard Glossary defines stress testing as submitting the system to extreme workload processing and resource utilization levels. Performance testing, by contrast, checks whether response time, throughput, and utilization targets hold under a defined, typically expected load.
- Load testing: Can the system handle expected peak demand within your targets?
- Stress testing: What breaks first when demand exceeds that envelope, and does recovery stay controlled?
- Soak testing: What degrades when a demanding load is sustained over time?
Load testing measures speed inside the envelope. Software stress testing measures resilience outside it.
Use that distinction to set release criteria. Don't ask for one headline response time. Demand an evidence based map of capacity thresholds, failure modes, and recovery behavior across concurrent users, transaction rates, request size, CPU, memory, network saturation, database connections, and queue depth. If you can't name the first resource to saturate, you don't have a stress result yet.
Designing Stress Tests You Can Trust
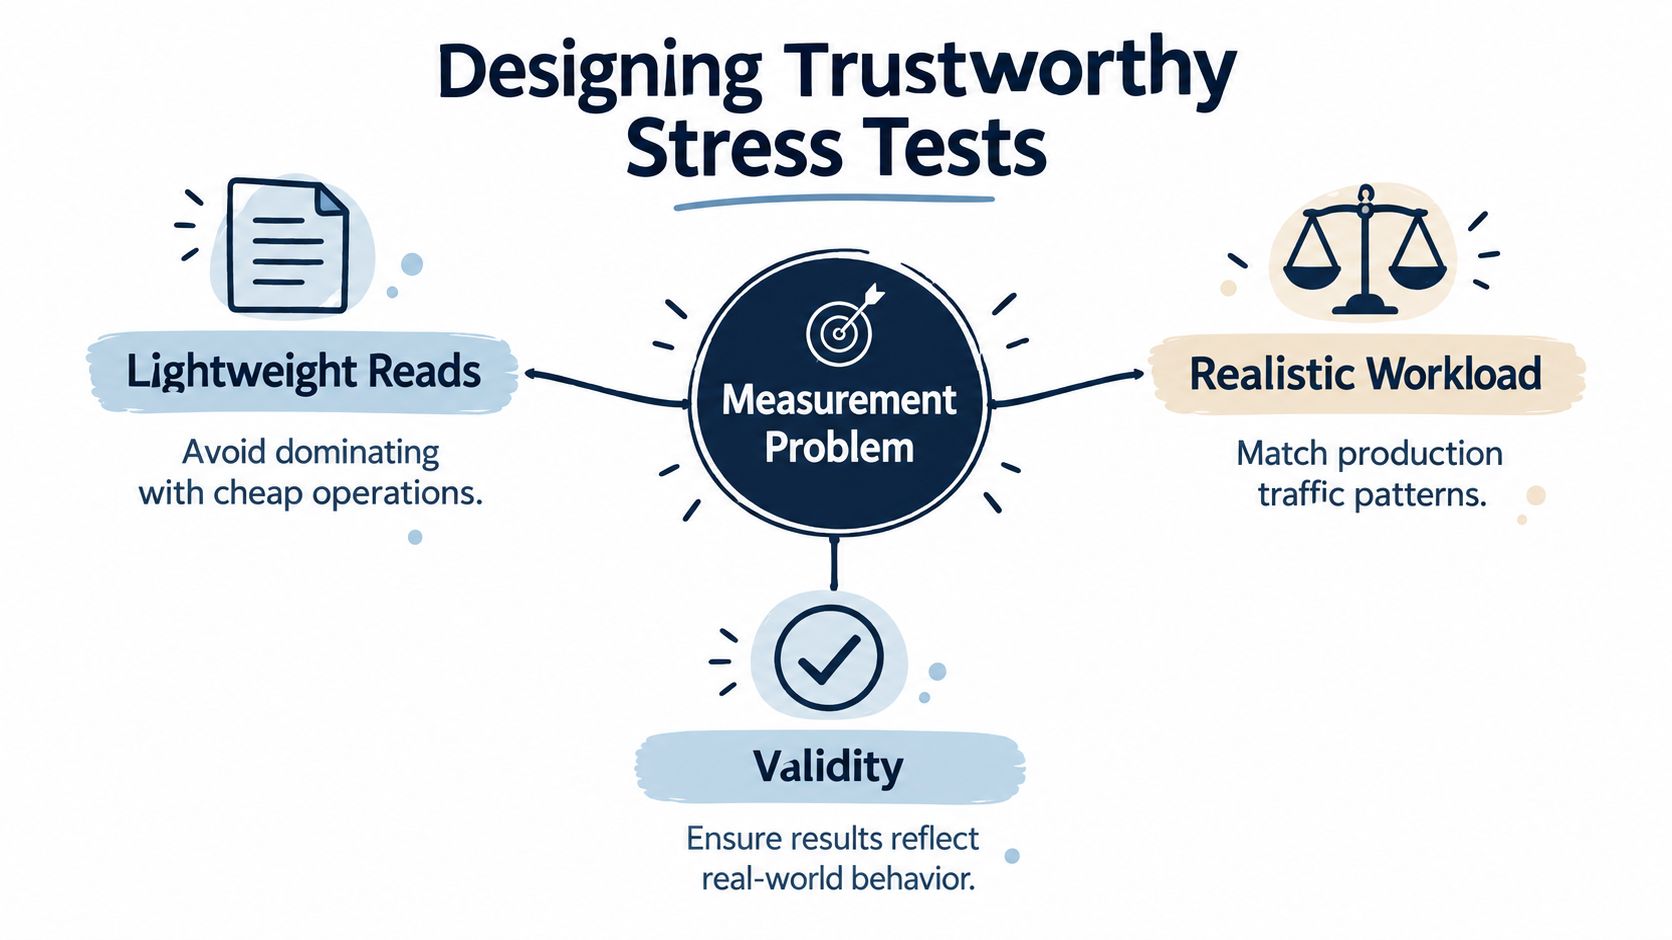
A headline load target means little if the workload does not represent production. If lightweight reads dominate the test, it can show spare capacity while write-heavy, authenticated, or database-intensive journeys fail much earlier.
Start with production telemetry. Match transaction mix, request sizes, data volumes, authentication flows, think time, and uneven user behavior. When test users behave more uniformly than real users, label the result directional, not proof. Measurement validity comes first; traffic volume comes second.
Rule Out a Generator Ceiling
The load generator can fail before the application does. Agent CPU, network bandwidth, open connections, file descriptors, or client-side timeouts can create a generator ceiling that looks like the application's breaking point. Check generator saturation, distribute agents when needed, and record generator health alongside application metrics.
A trustworthy result must answer three questions:
- Workload validation: Does the test include expensive journeys, not only frequent ones?
- Attribution: Which resource saturated, in which component, and at what stage?
- Confidence limits: What did the test not model, such as cache warmth, data skew, or third-party behavior?
Test duration also affects what you can observe. A large-scale study cited in the verified research found that full tests could run for as long as 24 hours. A reduction method cut execution to less than 8.5 hours while retaining at least 95% coverage of observed performance-metric combinations. Shorter tests can still be useful, but cutting combinations without validation can hide nonlinear bottlenecks.
Microsoft recommends progressive, controlled production testing with monitoring for latency, throughput, errors, and resource utilization in its Azure performance testing guidance. Set guardrails and rollback criteria before testing in production.
Practical rule: Prefer a smaller representative workload with validated bottleneck attribution over a headline 10x run you cannot explain.
Building Realistic Stress Scenarios Step by Step
A payment flow that saturates database connections before CPU peaks is a release risk, even if a headline traffic target has not been reached. Build the scenario to test that hypothesis. A smaller workload with validated journeys and observable dependencies gives a sounder release decision than an arbitrary high-volume run.
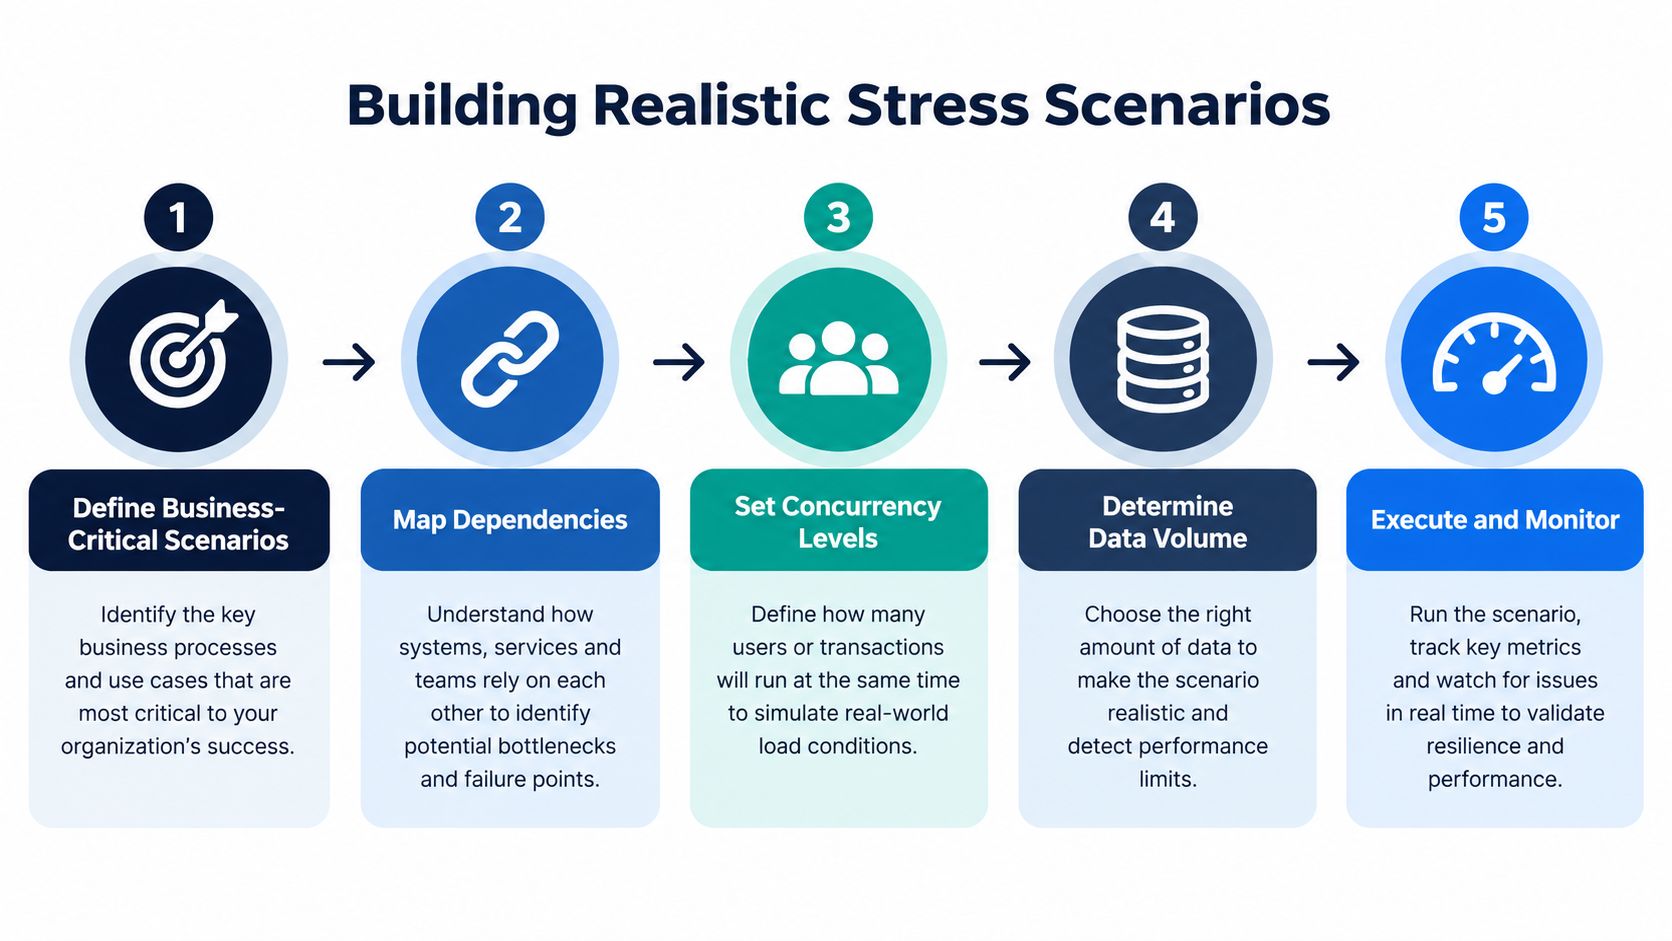
Start by choosing a business-critical journey, such as checkout, login, search, payment, or an API flow with contractual risk. Trace its full path through databases, queues, caches, external APIs, and autoscaling triggers. For distributed systems, define scenario boundaries around service ownership and dependency behavior. Practical microservices testing can help frame the contracts and dependency assumptions behind those paths.
Set measurable objectives before running the test: concurrency, data volume, throughput, latency, errors, and recovery. Then use a staged protocol. Microsoft distinguishes expected-peak measurement from deliberately exceeding normal limits to find the breaking point and evaluate recovery in its Azure testing guidance for operational excellence.
At each stage, hold the workload long enough to observe queues, resource saturation, and autoscaling behavior. Record when latency or errors change, and identify the component that fails first. Then remove load deliberately. Confirm that throughput, errors, and queues return to baseline without restarts. Those observations make the result useful for a release decision, rather than a simple record of traffic volume.
Keep the environment close to production in infrastructure, configuration, instance shape, and representative data. A smaller database or warmer cache changes the experiment, and may shift the apparent bottleneck between code, database, network, queues, and scaling policy.
Finish with a capacity curve. Record the last sustainable operating point, the first saturated resource, the failure threshold, and recovery time. Use these results to define a workload that reflects actual release risk. If the test cannot identify where capacity gives way and whether the system recovers, increase its measurement validity before increasing traffic.
Tools and Environments Worth Considering
A load generator can report a clean run while measuring the wrong system. Choose tools and environments that let your team validate the workload, correlate client results with server behavior, and repeat the test from version-controlled scripts. A smaller, validated scenario gives a stronger release signal than a headline traffic run built on assumptions.
| Tool | Best fit | CI/CD fit | Scripting style |
|---|---|---|---|
| k6 | Developer-owned API and web journeys | Strong, CLI-driven | JavaScript |
| JMeter | Broad protocol coverage and mixed tester teams | Workable, often GUI-led | GUI and XML-based plans |
| Gatling | High-concurrency API simulations | Strong for code-centric teams | Code as config, Scala, Java, or Kotlin |
| Locust | Python teams modeling user behavior | Strong, lightweight | Python |
| Azure Load Testing | Managed, large-scale cloud generation | Strong in Azure pipelines | Managed service, often JMeter-based |
Choose by operating constraint. Use k6 for fast developer feedback near the code. Choose JMeter when testers rely on a mature GUI or need protocols beyond plain HTTP. Gatling suits code-based, high-concurrency simulations; Locust makes user behavior readable to Python teams, though generator efficiency may be a tradeoff. Use Azure Load Testing if your team wants managed distributed generators rather than operating them.
Before comparing tool output, check whether the test environment preserves the variables that shape results: instance types, resource limits, autoscaling rules, connection pools, and dependency routing. Use production-shaped data volumes, cardinality, and skew, while handling sensitive data safely. Staging also needs the tracing, queue metrics, and database insights available in production. Without that observability, you cannot tell whether the workload exposed a real constraint.
Reject reports limited to client-side response time. Correlate each test stage with server saturation, database pressure, queue depth, and error classification. If the tool cannot support that view, it can generate traffic but cannot validate the measurement you need for a release decision.
Interpreting Results and Spotting Real Bottlenecks
A headline load level cannot validate a release if the test itself produces misleading measurements. Use a smaller workload that reproduces the system's real request mix and yields stable, attributable results before trusting a dramatic 10x run. Start with tail latency: averages hide users who timed out or retried, adding pressure. Track p95 and p99 latency, throughput, error rate, CPU, memory, saturation, queue depth, timeout rate, retry amplification, rejected requests, and recovery time at each test stage.
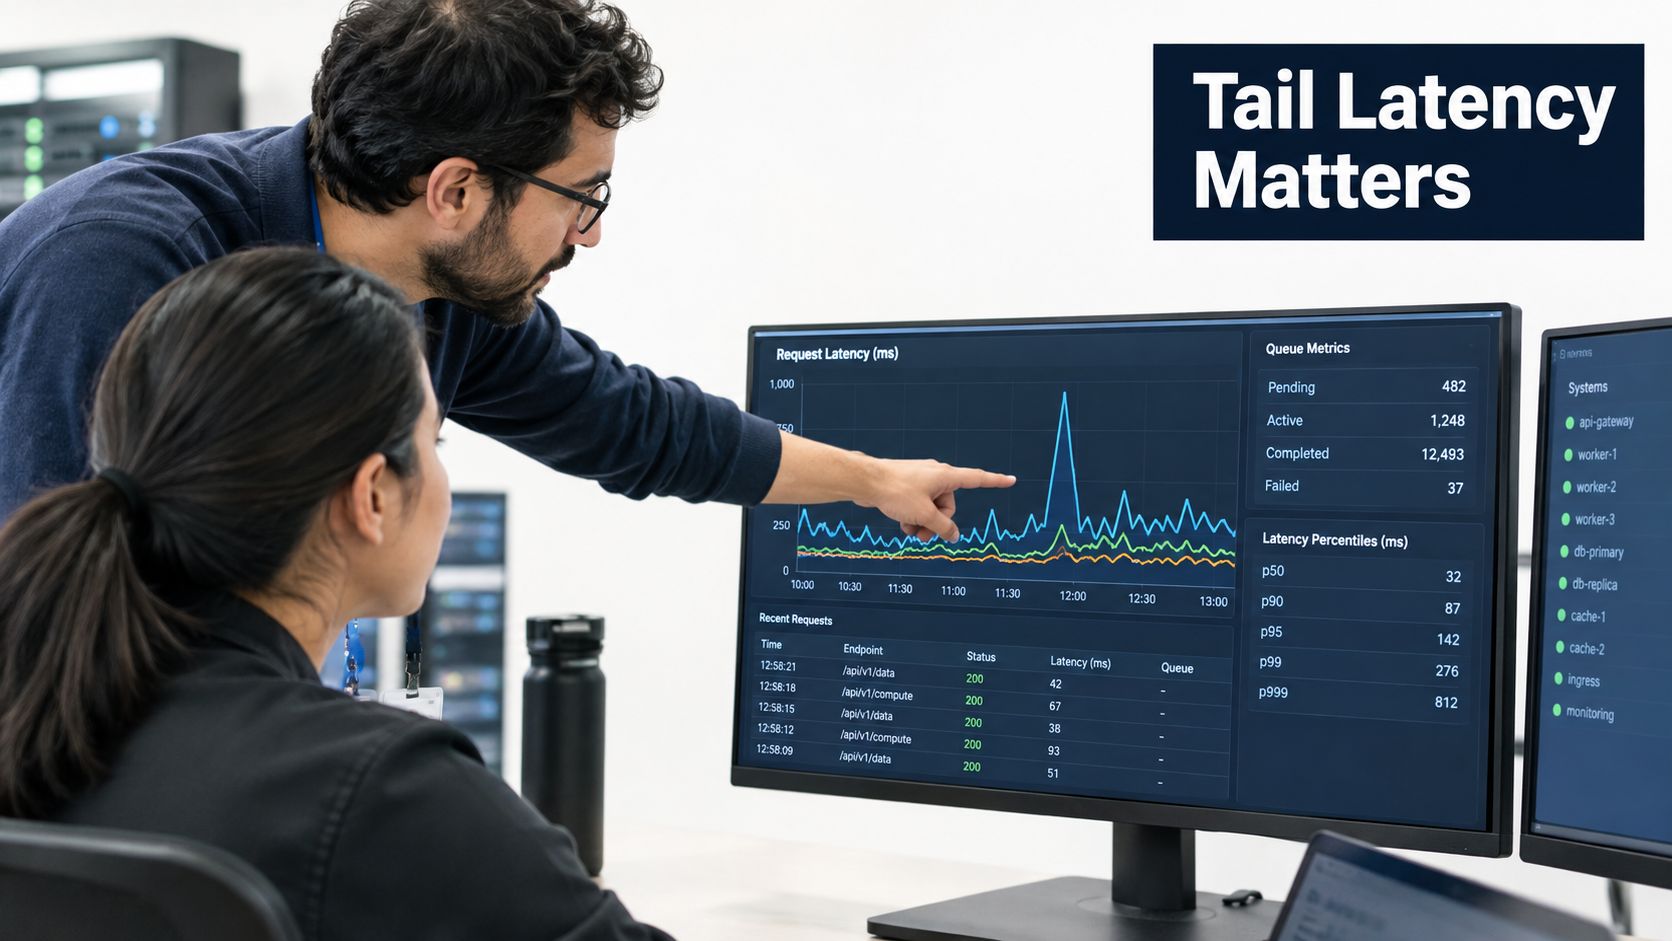
Google SRE guidance calls for measuring resource to capacity ratios, testing beyond rated capacity, and checking whether overload triggers graceful load shedding, controlled queues, and dynamic timeouts. Follow that sequence: locate the first saturated resource, then assess the system's response against the SRE service best practices guidance.
Queue growth often exposes the first constraint. If depth rises while throughput stalls, more traffic increases waiting, timeouts, and retries rather than completed work. Trace the queue to its producer, consumer, and downstream dependency, then use bottleneck analysis in performance testing to identify the limiting resource.
Judge the result by behavior under pressure:
- Pass: Noncritical work sheds first, protecting critical user journeys.
- Pass: Admission controls reject excess work predictably, before it times out.
- Pass: Circuit breakers stop requests from waiting indefinitely on slow dependencies.
- Fail: Retries add load faster than the system drains its queues.
- Fail: Recovery requires manual restarts, cache clearing, or database intervention.
A useful overload result permits controlled rejection, preserves critical work, and recovers automatically. State the constraint plainly: “Database connections exhausted during checkout” gives the release team an actionable finding. “Performance degraded under load” does not.
Common Failure Modes Stress Tests Expose
More traffic doesn't equal better testing. If you don't know whether the generator, network, application, or database hit its ceiling, a dramatic collapse teaches you very little. Challenge every failure claim until attribution is specific.
Well designed software stress testing exposes defect classes functional checks routinely miss. Memory leaks appear under sustained allocation pressure. Threading faults and deadlocks appear when concurrency spikes change lock ordering and contention. Throughput collapses when autoscaling reacts slower than demand or a downstream limit blocks every new instance equally.
Failure Patterns to Name in the Report
- Connection pool exhaustion: Requests wait for database or downstream connections until timeouts cascade.
- Retry storms: Clients and services retry synchronized failures, multiplying load during partial outage.
- Queue backpressure failure: Producers keep accepting work after consumer lag makes timely completion impossible.
- Longevity degradation: Memory, file handles, cache fragmentation, or log growth slowly erode capacity.
- Contention collapse: Response times rise sharply when CPU, locks, or database rows become shared choke points.
The economic stakes aren't abstract. A historical study prepared for the U.S. National Institute of Standards and Technology estimated inadequate testing infrastructure cost approximately $59.5 billion annually, with more than half of defects undetected until downstream production, as summarized in RadView's discussion of common load testing mistakes. That same summary notes testing consumed roughly 50% of software development budgets.
Don't misuse those figures as a stress testing ROI guarantee. Use them correctly. Finding resource exhaustion late is expensive because production adds outages, emergency scaling, backlogs, and customer impact to the debugging bill.
Integrating Stress Tests into the Release Workflow
Don't run the full stress suite on every pull request. You'll make it slow, flaky, and ignored. Tier execution by decision value, environment cost, and how quickly a developer can act on the result.
A Tiered Placement That Works
- Pull request: Run short smoke performance scenarios on critical paths to catch obvious regressions in latency, errors, or resource use.
- Nightly: Run heavier load checks against staging with production shaped data and dependency coverage.
- Release candidate: Run full software stress testing through saturation and recovery, with explicit capacity and failure criteria.
- After major change: Rerun stress scenarios after architecture, infrastructure, scaling, or dependency changes, even outside the normal cadence.
That placement only works if pipeline stages, artifacts, and gates are unambiguous, which is why it helps to align terminology around what a CI/CD pipeline includes before adding performance gates to it.
Block a release when the capacity curve drops materially, a new resource becomes first to saturate, critical work isn't protected during shedding, or recovery fails. Flag for review when tail latency trends upward without crossing the agreed threshold, or when cost per successful transaction rises because autoscaling adds capacity earlier than before.
Trend every run. The resource to capacity ratio changes as code, traffic mix, data volume, and dependencies evolve. A single passing result expires quickly, so compare the last sustainable point, saturation order, and recovery time across releases. That's how stress testing becomes a release signal instead of a pre launch fire drill.
Recommendations for Building a Stress Testing Practice
Start narrow and make the first result undeniable. Map two or three business critical journeys, validate their workload against production telemetry, and prove your generators have headroom before you increase volume. If AskYourQA is brought in for this kind of work, it provides performance testing services that include realistic traffic scenarios and bottleneck analysis, which is one route to building that validated starting point.
What Done Looks Like
- Journey map approved: Product, engineering, and QA agree which flows can block a release.
- Workload validated: Mix, payloads, data, and auth behavior match observed production patterns.
- Mirror environment ready: Configuration, limits, scaling, and observability match production closely enough for attribution.
- Pass criteria written: Capacity curve, shedding behavior, error shape, and recovery time are defined before execution.
- Pipeline tiers live: Smoke, nightly, and release candidate runs have separate owners and thresholds.
- Trends reviewed: Each release compares saturation order and last sustainable point with the previous baseline.
Prioritize high signal, validated scenarios over headline peak load numbers. A CTO doesn't need a bigger chart. They need to know what breaks first, what users experience when it breaks, whether the system recovers alone, and what engineering change moves that limit. Build your practice to answer those four questions every release.
If your next release needs that level of certainty, AskYourQA can design validated stress scenarios around your critical journeys, integrate them into your CI/CD pipeline, and turn the results into clear capacity and recovery gates. Visit AskYourQA to discuss a performance testing system that gives your team actionable release evidence, not just more synthetic traffic.